Published: 9 September 2014
Cost of an hour worked increased by 2.9 per cent in April to June
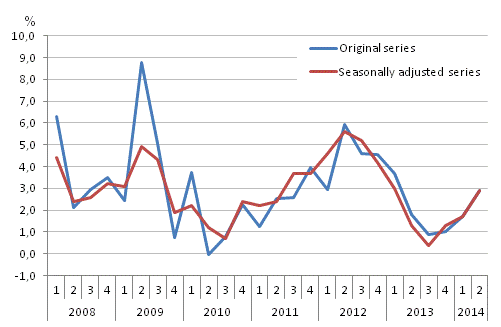
In the private sector, labour costs increased by 2.9 per cent in April to June 2014 when compared with the respective period of the year before. Seasonally adjusted labour costs rose by 2.9 per cent in April to June 2014. Labour costs excluding one-off items, such as performance-based bonuses, went up by 2.3 per cent compared with the respective period of the year before. In the corresponding period, the index of wage and salary earnings rose by 1.6 per cent in the private sector.
Year-on-year change in labour costs in the private sector from the respective quarter of previous year

In the central government sector, labour costs grew by 5.9 per cent in April to June 2014 when compared with the respective period of the year before. Labour costs excluding one-off items rose by 6.1 per cent in the corresponding period. Seasonally adjusted labour costs grew by 4.9 per cent. In the local government sector, labour costs increased 2.2 per cent in April to June 2014 compared with the respective period of the year before. Costs excluding one-off items grew by 3.2 per cent.
The increase in social insurance contributions raised the cost of an hour worked in all sectors compared with the year before. Without social security contributions, the cost of an hour worked grew by 2.7 per cent in the private sector, by 5.1 per cent in the central government sector, and by 1.9 per cent in the local government sector. The second quarter of 2014 had one working day fewer than in 2013. The variation in the number of working days in the same quarter between different years has an effect on labour costs, because the cost is calculated per hours worked. The lower number of working days compared with the reference period raises the cost calculated per hours worked. In addition to the above, the increase in the cost of an hour worked in the central government sector is explained by the growing number of paid hours of absence compared with the corresponding period of the year before.
Calculated by industry, the cost of an hour worked in all manufacturing went up by 4.2 per cent in April to June 2014 when compared with the respective period of the year before. The cost of an hour worked increased most in the forest industry, where it grew by 8.6 per cent. The cost of an hour worked increased least in the chemical industry, by 1.0 per cent. In services, the cost of an hour worked increased most in financial and insurance activities, by 4.4 per cent, and most moderately in transportation and storage, 2.0 per cent. In business service activities, the costs of an hour worked went up by 2.6 per cent.
Seasonally adjusted cost of an hour worked increased by 4.4 per cent in all manufacturing in April to June 2014 when compared with the respective period of the year before. In the forest industry, the cost of an hour worked increased by 7.9 per cent, and in the chemical industry by 2.2 per cent in April to June 2014 compared with the respective period of the year before. The rise in the cost of an hour worked in business service activities was 2.6 per cent. In financial and insurance activities, the cost of an hour worked went up by 3.3 per cent, while in transportation and storage the cost increased by 1.7 per cent.
Annual changes in labour costs according to Standard Industrial Classification 2008, 2nd quarter 2014
| Code | Industry | Labour Costs, Year-on-year change |
||
| Labour costs | Labour costs, excluding one-off items |
Labour Costs, seasonally adjusted | ||
| B-S | Total | 2,9 | 2,3 | 2,9 |
| B-E | Industry | 4,2 | 3,6 | 4,4 |
| F | Construction | 2,4 | 1,7 | 2,6 |
| G-N | Business service sector | 2,6 | 2,0 | 2,6 |
| J-R | State sector | 5,9 | 6,1 | 4,9 |
| D-S | Local government sector | 2,2 | 3,2 | .. |
Source: Wages, Salaries and Labour Costs, Statistics Finland
Inquiries: Pekka Haapala 029 551 3460, Hanna Jokimäki 029 551 3667, tvkindeksi@stat.fi
Director in charge: Hannele Orjala
Publication in pdf-format (306.0 kB)
- Tables
-
Tables in databases
Pick the data you need into tables, view the data as graphs, or download the data for your use.
Appendix tables
- Appendix table 1. Labour costs, Labour Cost Index 2008=100 (9.9.2014)
- Appendix table 2. Labour costs, percentage changes, Labour Cost Index 2008=100 (9.9.2014)
- Appendix table 3. Labour costs, excluding one-off items, Labour Cost Index 2008=100 (9.9.2014)
- Appendix table 4. Labour costs, excluding one-off items, percentage changes, Labour Cost Index 2008=100 (9.9.2014)
- Appendix table 5. Seasonally adjusted labour costs, Labour Cost Index 2008=100 (9.9.2014)
- Appendix table 6. Seasonally adjusted labour costs, percentage changes, Labour Cost Index 2008=100 (9.9.2014)
- Appendix table 7. Standard Industrial Classification 2008 (9.9.2014)
- Revisions in these statistics
-
- Revisions in these statistics (9.9.2014)
Updated 9.9.2014
Official Statistics of Finland (OSF):
Labour cost index [e-publication].
ISSN=1798-3746. 2nd quarter 2014. Helsinki: Statistics Finland [referred: 10.2.2026].
Access method: http://stat.fi/til/tvki/2014/02/tvki_2014_02_2014-09-09_tie_001_en.html

