Published: 20 August 2020
Sea transport decreased by two per cent in 2019
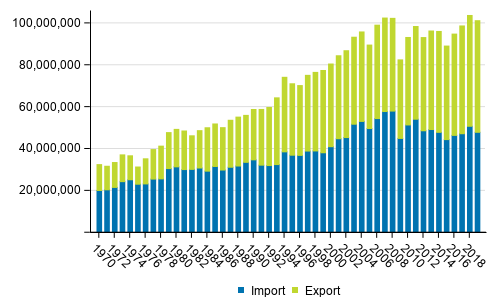
During 2019, the goods volume of foreign sea transport totalled 101.3 million tonnes. Sea transport went down by two per cent from the year before. Exports grew by one per cent and amounted to 53.3 million tonnes. Imports fell by six per cent and amounted to 48.0 million tonnes. A total of 19.1 million persons were transported in passenger traffic, which is about half a per cent more than in 2018. Over 90 per cent of the passengers transported by sea travelled on routes to Estonia and Sweden. A total of 3.3 million transport equipment were transported. Of them, 64 per cent were passenger cars belonging to passengers.
Foreign sea transport (tonnes) 1970–2019

Goods transport
The goods volume of foreign sea transport was in total 101.3 million tonnes. Of this, transit transport made up nine per cent, or nine million tonnes. General cargo was transported most, in total 17.5 million tonnes, followed by 11.9 million tonnes of crude oil. The most imported type of goods was crude oil, which represented 25 per cent of all goods imported by sea. Oil products, general cargo and paper were exported most. These types of goods form 48 per cent of all goods exports in sea transport. The busiest ports for goods transport were Sköldvik, HaminaKotka, Helsinki, Kokkola and Rauma. The largest import ports were Sköldvik, Helsinki, Naantali, Raahe and HaminaKotka. The biggest export ports were HaminaKotka, Sköldvik, Helsinki, Kokkola and Rauma.
Table 1. Volume of goods transported in foreign sea transport by type of goods in 2017 to 2019
| Direction and commodity group | Year | |||
| 2017 | 2018 | 2019 | ||
| Export | Timber | 379,832 | 839,970 | 714,705 |
| Sawn wood | 4,183,489 | 3,749,891 | 3,962,493 | |
| Wood pulp | 3,339,436 | 3,600,683 | 3,874,226 | |
| Paper | 8,136,067 | 8,157,124 | 7,563,773 | |
| Plywood and veneers | 295,747 | 259,001 | 245,719 | |
| Ores and concentrates | 5,386,047 | 5,001,231 | 4,367,797 | |
| Metals and metal manufactures | 3,223,492 | 3,338,673 | 2,887,695 | |
| Crude oil | - | 9 | 40 | |
| Oil products | 9,046,997 | 8,935,661 | 9,166,173 | |
| Coal and coke | 257,972 | 973,354 | 1,365,453 | |
| Fertilizers | 2,873,173 | 3,096,333 | 3,577,862 | |
| Chemicals | 3,291,016 | 3,403,378 | 3,557,791 | |
| Crude minerals and cement | 1,191,530 | 1,150,091 | 1,454,668 | |
| Cereals | 622,442 | 415,069 | 547,694 | |
| General cargo | 8,298,230 | 9,002,069 | 8,701,379 | |
| Other merchandise | 957,470 | 998,984 | 1,317,860 | |
| Total | 51,482,940 | 52,921,521 | 53,305,328 | |
| Import | Timber | 1,506,548 | 3,167,139 | 3,022,638 |
| Sawn wood | 18,397 | 36,216 | 32,219 | |
| Wood pulp | 449,514 | 430,809 | 309,255 | |
| Paper | 231,709 | 208,360 | 212,113 | |
| Plywood and veneers | 38,931 | 32,547 | 39,346 | |
| Ores and concentrates | 4,341,494 | 4,855,165 | 4,274,233 | |
| Metals and metal manufactures | 1,352,950 | 1,279,761 | 1,370,915 | |
| Crude oil | 11,270,400 | 11,889,441 | 11,939,810 | |
| Oil products | 4,617,498 | 4,767,546 | 4,658,124 | |
| Coal and coke | 4,277,678 | 4,254,867 | 3,407,649 | |
| Fertilizers | 261,221 | 256,369 | 259,915 | |
| Chemicals | 2,712,816 | 2,815,815 | 2,669,110 | |
| Crude minerals and cement | 4,681,539 | 4,779,894 | 4,024,729 | |
| Cereals | 61,261 | 124,896 | 62,498 | |
| General cargo | 9,072,946 | 9,214,655 | 8,877,333 | |
| Other merchandise | 2,399,911 | 2,744,086 | 2,823,196 | |
| Total | 47,294,813 | 50,857,566 | 47,983,083 | |
Goods transport in containers and transport equipment
A total of 13 million tonnes of goods were transported in containers through Finnish ports in 2019. The figure was 1.4 per cent lower than in 2018. The number of containers transported was 922,471 (1,617,879 TEU containers) 1) . Exports of goods transported in containers grew by 1.8 per cent measured in tonnes and imports fell by eight per cent compared with 2018.
A total of 16 million tonnes of goods were transported by goods transport equipment and 1.2 million transport equipment were transported in total. Of goods transport equipment, lorries and lorry trailers were transported most, in all 1.1 million. A total of 45,966 other transport equipment were transported. The volume of goods transported by transport equipment and containers totalled 29.5 million tonnes, which is 29 per cent of all goods transported in sea transport.
Transport performance of foreign sea transport
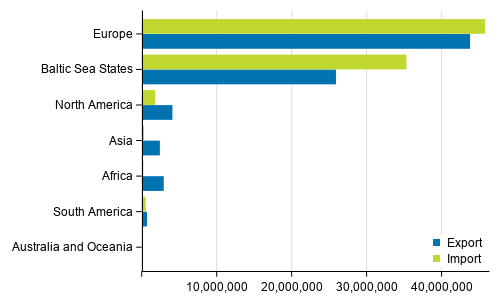
During 2019, the transport performance of foreign sea transport totalled 231.7 billion tonne-kilometres. The transport performance of exports amounted to 161.1 billion tonne-kilometres and that of imports to 70.6 billion tonne-kilometres. In all, 73 per cent of goods imported by foreign sea transport came from the Baltic Sea states and only five per cent from other than European ports. Altogether 48 per cent of export goods were exported to the Baltic Sea states and 18 per cent were exported outside European ports. Differences in import and export countries are reflected directly in the transport performance. The transport performance grew by 12 per cent compared with 2018.
Exports and imports by area year 2019

Transit transport
Transit transport through Finnish ports totalled nine million tonnes. Most of this was transit exports, 8.4 million tonnes. Transit imports amounted to 0.6 million tonnes The majority of transit exports consists of ores and concentrates, as well as fertilisers, chemicals and coal and coke. These groups of goods form 96 per cent of transit shipments. Over one-half of transit imports are general cargo. Transit transport went down by half a per cent from 2018. Export transit went up by 1.1 per cent and import transit fell by 19 per cent.
Table 2. Volume of goods transported in transit traffic by type of goods in 2017 to 2019
| Direction and commodity group | Year | |||
| 2017 | 2018 | 2019 | ||
| Export | Timber | 745 | 938 | 96 |
| Sawn wood | 8,499 | 15,916 | 27,703 | |
| Wood pulp | 3,351 | 10,517 | 3,146 | |
| Paper | 4,553 | 19,245 | 29,781 | |
| Plywood and veneers | 4,351 | 2,166 | 1,437 | |
| Ores and concentrates | 4,392,285 | 3,947,160 | 3,147,988 | |
| Metals and metal manufactures | 20,834 | 22,845 | 28,189 | |
| Oil products | 65,306 | 66,315 | 94,598 | |
| Coal and coke | 62,499 | 840,139 | 1,167,260 | |
| Fertilizers | 1,450,352 | 1,707,391 | 2,122,805 | |
| Chemicals | 1,427,223 | 1,560,445 | 1,658,448 | |
| Crude minerals and cement | 1,315 | 3,145 | 883 | |
| Cereals | 63 | 2,786 | 5,044 | |
| General cargo | 72,274 | 79,974 | 93,120 | |
| Other merchandise | 30,483 | 24,775 | 17,013 | |
| Total | 7,544,133 | 8,303,757 | 8,397,511 | |
| Import | Timber | 183 | - | 24 |
| Sawn wood | 7,052 | 14,499 | 23,524 | |
| Wood pulp | 508 | 1,227 | 1,056 | |
| Paper | 9,765 | 4,789 | 1,963 | |
| Plywood and veneers | 3,302 | 1,582 | 3,818 | |
| Ores and concentrates | 316 | 204 | 592 | |
| Metals and metal manufactures | 88,997 | 72,891 | 55,518 | |
| Crude oil | 133 | - | 14 | |
| Oil products | 519 | 235 | 410 | |
| Coal and coke | 2,856 | 1,101 | 3,166 | |
| Fertilizers | - | 1,203 | 27 | |
| Chemicals | 46,304 | 53,219 | 48,403 | |
| Crude minerals and cement | 3,140 | 9,515 | 9,021 | |
| Cereals | 552 | 331 | 313 | |
| General cargo | 612,009 | 468,014 | 316,096 | |
| Other merchandise | 53,914 | 97,618 | 126,797 | |
| Total | 829,550 | 726,428 | 590,742 | |
Passenger traffic
A total of 19.1 million persons were transported in passenger traffic in 2019. In all, 9 million persons travelled between Finland and Estonia and 8.6 million between Finland and Sweden. Altogether, 0.2 million passengers were transported between Finland and Russia and 0.2 million passengers between Finland and Germany. The number of passengers grew by about half a per cent compared to 2018. In 2019, a total of 1.2 million passengers of foreign cruise ships arrived in Finland. The number of cruise passengers grew by 16 per cent from the year before. In 2019, a total of 2.2 million passengers’ cars were transported and 40,000 buses and coaches. Transports of passengers’ cars increased by 1.2 per cent and bus transports decreased by 6.6 per cent.
Goods volume in the Saimaa Canal
A total of 980,053 tonnes of goods were transported through the Saimaa Canal in foreign traffic. Timber was transported most in vessels in foreign traffic, in total 403,317 tonnes. The second most transported were crude minerals and cement, 293,273 tonnes. The volume of traffic through the Saimaa Canal decreased by 20 per cent from 2018.
1) TEU, the basic measurement unit of container traffic, refers to one container that is twenty feet long, eight feet wide and 8.5 feet high.
Source: Transport and tourism, Statistics Finland
Inquiries: Matti Kokkonen 029 551 3770, matti.kokkonen@stat.fi
Director in charge: Mari Ylä-Jarkko
Publication in pdf-format (211.1 kB)
- Tables
-
Tables in databases
Pick the data you need into tables, view the data as graphs, or download the data for your use.
Updated
Official Statistics of Finland (OSF):
Foreign Shipping Traffic [e-publication].
ISSN=2670-2002. 2019. Helsinki: Statistics Finland [referred: 9.2.2026].
Access method: http://stat.fi/til/uvliik/2019/uvliik_2019_2020-08-20_tie_001_en.html

