

This set of statistics has been discontinued.
New data are no longer produced from the statistics.
Published: 11 December 2013
The value of insurance companies' investments stood at EUR 109.1 billion at the end of 2012
Corrected on 30 October 2018. The figures for non-life insurance companies were updated with data on two companies.The corrections are indicated in red.
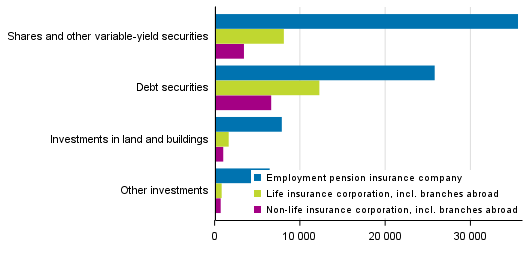
The largest investment activity items in insurance activities are shares and equity, as well as financial market instruments, e.g. bonds. Other investment objects include real estate investments and loans. The balance sheet value of investment activities amounted to EUR 109.1 billion at the end of 2012 and the share of employment pension companies was 69 per cent. The chart below shows the distribution of investments by item.
Insurance companies' investments 31 December 2012, EUR million (Corrected on 30 October 2018)
Income from insurance activities are primarily comprised of insurance premiums, net income from investment activities and other income. The insurance premiums amounted to nearly EUR 20 billion in 2012, a majority of which was generated in employment pension insurance, good EUR 12 billion.
More detailed insurance company specific data can be found in the database tables of these statistics and from the web pages of other organisations that produce insurance data (link in the left-hand menu under "Links" of the statistics' home page).
Statistics Finland publishes new statistics on Insurance activities. The statistics cover activity data of employment pension, life insurance and non-life insurance companies, e.g. profit and loss account, balance sheet, and classes of insurance and insurance portfolio. The data are based on the Financial Supervision Authority's data collection on domestic activities of corporations engaged in the insurance markets. It should be noted that insurance companies' financial statements and the indicators calculated based on these differ considerably from the financial statement formula of enterprises operating in other industries. The financial statement structure differs in many respects between employment pension, life insurance and non-life insurance companies. The data concerning life insurance and non-life insurance companies also include branches abroad.
Source: Insurance Activities 2012, Statistics Finland
Inquiries: Kristiina Nieminen 09 1734 2957, Kerttu Helin 09 1734 3330, Hilkka Jaatinen 09 1734 3630, rahoitusmarkkinat@stat.fi
Director in charge: Leena Storg�rds
Publication in pdf-format (276.7 kB)
- Tables
-
Tables in databases
Pick the data you need into tables, view the data as graphs, or download the data for your use.
Appendix tables
- Appendix table 1. Balance sheets of insurance companies 2012, EUR million (Corrected on 30 October 2018) (11.12.2013)
- Appendix tabel 2. Insurance payments and liabilities of employment pension companies 2012 (11.12.2013)
- Appendix tabel 3. Insurance portfolios of employment pension companies 2012 (11.12.2013)
- Appendix tabel 4. Insurance payments and liabilities of life insurance companies 2012 (11.12.2013)
- Appendix tabel 5. Insurance portfolios of life insurance companies 2012 (Corrected on 31 August 2017) (11.12.2013)
- Appendix tabel 6. Insurance portfolios and payments of non-life insurance companies 2012 (Corrected on 30 October 2018) (11.12.2013)
- Appendix tabel 7. Insurance class-specific data of life insurance companies 2012 (11.12.2013)
- Appendix tabel 8. Insurance class-specific data of non-life insurance companies 2012 (Corrected on 31 August 2017) (11.12.2013)
- Figures
Updated 11.12.2013
Official Statistics of Finland (OSF):
Insurance Activities [e-publication].
ISSN=2341-7625. 2012. Helsinki: Statistics Finland [referred: 21.7.2026].
Access method: http://stat.fi/til/vato/2012/vato_2012_2013-12-11_tie_001_en.html