Published: 11 July 2013
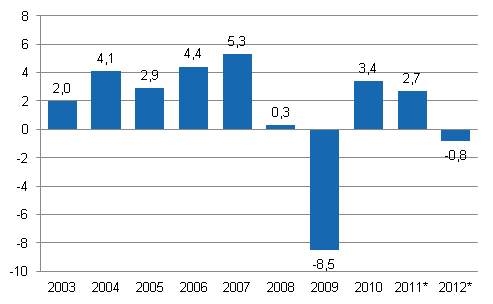
Gross domestic product fell by 0.8 per cent in 2012
According to Statistics Finland's revised preliminary data, the volume of Finland’s GDP contracted by 0.8 per cent in 2012. According to the initial preliminary data released in March, the decrease was 0.2 per cent. The GDP became revised downwards as new data on intermediate consumption in manufacturing and other industries became available. The preliminary data published in March were mainly based on turnover data.
Annual change in the volume of gross domestic product, per cent

Statistics Finland has also reviewed national accounts for the years 2010 to 2011. The volume of GDP grew by 3.4 per cent in 2010 (was 3.3 per cent) and by 2.7 per cent in 2011 (was 2.8 per cent).
Households' adjusted disposable income describing their economic well-being grew by 0.1 per cent in real terms last year. In addition to net income, adjusted income also takes into consideration the individual services that the public sector and organisations produce for households, such as educational, health and social services.
Demand items in the national economy remained at previous year's level. The volume of consumption expenditure grew only by 0.3 per cent. The volume of investments decreased by one per cent. The growth in inventories was considerably lower than the year before. The volume of exports shrunk by 0.2 per cent and that of imports by one per cent.
Share of manufacturing exceptionally low
Development of total output worked in two directions last year. Value added in manufacturing decreased considerably. Especially value added in the electronics industry diminished. Value added grew in some industries like pharmaceutical products and pharmaceutical preparations, and energy supply. The share of total manufacturing of the added value of the whole national economy was exceptionally low at 19 per cent.
Value added grew in most service sectors. Measured by volume, most growth was seen in business activities, financial intermediation, telecommunications, and transport.
Non-financial corporations’ profits diminished
Non-financial corporations' operating surplus describing profits from their actual operations contracted by 7.5 per cent from the previous year. Non-financial corporations’ net lending, or financial position, showed a surplus of EUR three billion, as against EUR 2.3 billion in the previous year. The financial position weakened considerably compared to the preliminary data because profits were lower than estimated and more assets than estimated were used for capital formation.
The deficit of the current account was EUR 3.6 billion in 2012, while one year before it was EUR 2.7 billion.
General government deficit grew
Last year, the financial position of central government showed a notable deficit for the fourth successive year. The deficit (net borrowing) was EUR 7.3 billion, while one year before it was EUR 6.4 billion. The deficit increased because current transfers paid grew more than tax revenues.
The deficit of local government was EUR 2.1 billion, having been EUR one billion in the year before. The financial position of employment pension funds weakened as well from last year. The surplus was now EUR 4.8 billion, while one year before it was EUR 5.4 billion. Holding gains in assets are not taken into consideration in the financial position.
The total financial position, or net lending, of general government showed a deficit of EUR 4.2 billion (2.2 per cent of GDP), while the deficit in the previous year was EUR 1.9 billion.
Households' real income did not grow
Households’ disposable income grew by three per cent in nominal terms but remained on level with the previous year in real terms. Households’ final consumption expenditure increased by 3.2 per cent. Money spent on housing, food and health grew the most. Less money than before was spent on car purchases and telecommunications.
Households' consumption expenditure was lower than disposable income, so the savings ratio, or savings relative to disposable income, was, unlike indicated by the preliminary data, positive. Households’ financial position showed a deficit of EUR 4.1 billion. Households’ indebtedness continued growing and was 117.3 per cent, in other words, it grew by 2.3 percentage points over the year.
National Accounts 2003-2012, Tables, PDF
Source: National Accounts, Statistics Finland
Inquiries: Olli Savela 09 1734 3316, Tuomas Rothovius 09 1734 3360, skt.95@stat.fi
Director in charge: Leena Storgårds
Publication in pdf-format (282.8 kB)
- Reviews
- Tables
-
Tables in databases
Pick the data you need into tables, view the data as graphs, or download the data for your use.
Appendix tables
- Revisions in these statistics
-
- Revisions on these statistics (11.7.2013)
Updated 11.7.2013
Official Statistics of Finland (OSF):
Annual national accounts [e-publication].
ISSN=1798-0623. 2012. Helsinki: Statistics Finland [referred: 15.2.2026].
Access method: http://stat.fi/til/vtp/2012/vtp_2012_2013-07-11_tie_001_en.html

