Published: 3 March 2014
Gross domestic product contracted by 1.4 per cent last year
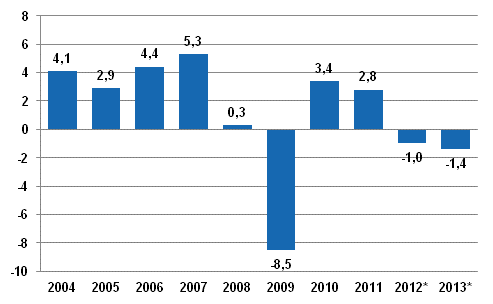
According to Statistics Finland’s preliminary data, the volume of Finland’s GDP contracted by 1.4 per cent in 2013. Last year, GDP that describes the output of the national economy stood at EUR 193 billion. National income describing the income of the national economy went down by 1.6 per cent in real terms.
Annual change in the volume of gross domestic product, per cent

Last year, demand in the national economy was depressed by decreases in private consumption and gross fixed capital formation. The volume of private consumption went down by 0.8 per cent but public consumption grew by 0.8 per cent. The growth in public consumption resulted from the classification of the Finnish Broadcasting Company changing from non-financial corporations to general government. This also decreased private consumption.
Private investments decreased by 6.4 per cent but public investments grew by 6.8 per cent. The volume of exports grew by 0.3 per cent but that of imports fell by 1.8 per cent.
Non-financial corporations' operating surplus describing profits from their actual operations contracted by 9 per cent in nominal terms. It is estimated that non-financial corporations paid 13 per cent more dividends than in the year before. Non-financial corporations' financial position showed a surplus of EUR 4.5 billion. The surplus grew from the previous year because gross fixed capital formation decreased by 8 per cent.
The financial position of general government, i.e. net lending, was in deficit for the fifth successive year, by EUR 4.6 billion. In the previous year, the deficit was EUR 4.3 billion. The deficit of local government decreased, as did the surplus of employment pension schemes.
Growth in households’ real income was almost stagnate for the second year in a row. Net disposable income fell by 0.3 per cent in real terms. Households' adjusted real income contracted by 0.1 per cent. Adjusted income also takes into consideration welfare services, i.e. the individual services that general government and organisations produce for households, such as educational, health and social services.
Wage and salary income grew by 1.0 per cent in nominal terms. However, social security benefits went up by 5.5 per cent, as the number of pensioners and unemployed increased. Property and entrepreneurial income decreased by 0.6 per cent.
National Accounts 2004 – 2013, Tables, PDF
Source: National Accounts, Statistics Finland
Inquiries: Olli Savela 09 1734 3316, Tuomas Rothovius 09 1734 3360, kansantalous@stat.fi
Director in charge: Leena Storgårds
Publication in pdf-format (397.9 kB)
- Reviews
- Tables
-
Tables in databases
Pick the data you need into tables, view the data as graphs, or download the data for your use.
Appendix tables
Updated 3.3.2014
Official Statistics of Finland (OSF):
Annual national accounts [e-publication].
ISSN=1798-0623. 2013. Helsinki: Statistics Finland [referred: 15.2.2026].
Access method: http://stat.fi/til/vtp/2013/vtp_2013_2014-03-03_tie_001_en.html

