Published: 9 July 2015
Gross domestic product contracted by 0.4 per cent last year
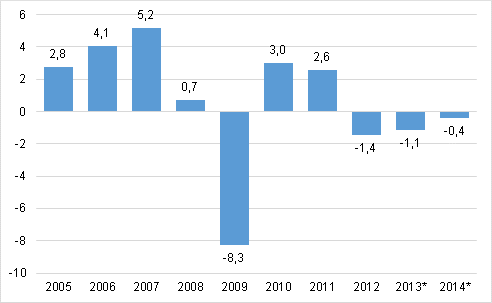
According to Statistics Finland’s revised preliminary data, the volume of Finland’s GDP contracted by 0.4 per cent in 2014. According to the initial preliminary data released in March, the decrease was 0.1 per cent. The GDP became revised as new data on intermediate consumption in various industries in particular became available.
In 2013, the volume of GDP contracted by 1.1 per cent whereas previous estimates put the decline at 1.3 per cent. Production contracted for the third year in a row last year and was at the 2006 level. Gross domestic product, or the value added created in the production of goods and services, amounted to EUR 205 billion at current prices.
Annual change in the volume of gross domestic product, per cent.

The volume of value added decreased in most industries last year, such as in manufacturing, construction, transport, and public administration. By contrast, the volume of value added increased, for example, in financial and insurance activities, computer and related services, and pharmaceutical preparations.
Demand did not generate growth
Demand items in the national economy remained at previous year's level or declined. Only the volume of public consumption expenditure grew slightly by 0.3 per cent. Private consumption expenditure increased by 0.5 per cent but public consumption expenditure decreased by 0.2 per cent.
The volume of investments decreased by 3.3 per cent. Investments in building constructions and in research and development declined in particular. By contrast, investments in machinery and equipment, computer software and civil engineering grew a little. The investment rate or the proportion of investments of gross domestic product fell to 20.3 per cent.
The volume of exports shrunk by 0.7 per cent in 2014 and that of imports remained unchanged. The volume of goods exports and imports increased slightly but the imports and exports of services decreased clearly.
Households' real income contracted
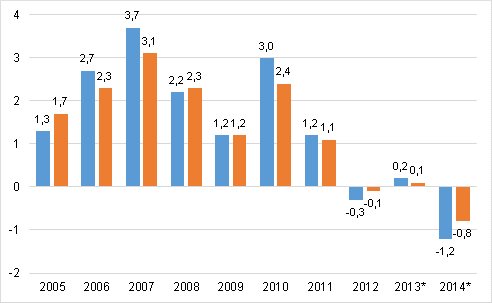
Households' disposable income declined by 1.2 per cent in real terms last year. Households' adjusted disposable income describing their economic well-being declined by 0.8 per cent in real terms last year. Adjusted income also includes welfare services produced by the public sector and organisations for households, such as educational, health and social services.
Annual change in households’ disposable real income (left column) and household's adjusted real income (right column), per cent

Households’ wage and salary income only went up by 0.3 per cent but social benefits by five per cent due, for example, to an increase in the number of pensioners and unemployed.
Non-financial corporations' operating surplus describing profits from their actual operations went up by five per cent from the previous year. The net saving of non-financial corporations increased by EUR 1.7 billion from the previous year. Non-financial corporations’ net lending, or financial position, showed a surplus of EUR 5.4 billion. The financial position was improved by the fact that fixed investments in Finland diminished by three per cent last year.
The economy of general government showed a deficit of EUR 6.8 billion last year. The deficit, or net borrowing according to national accounts, was 3.3 per cent of the gross domestic product. The deficit of central government was EUR 7.9 billion and that of local government amounted to EUR 1.7 billion. By contrast, the economy of employment pension schemes showed a surplus of EUR 3.4 billion. Other social security funds showed a deficit of EUR 0.7 billion.
General government's share of the gross value added that describes the size of the public economy was 20.8 per cent.
National Accounts 2005 to 2014, tables, PDF
Source: National Accounts.
Inquiries: Olli Savela 029 551 3316, Tuomas Rothovius 029 551 3360, kansantalous@stat.fi
Director in charge: Mari Ylä-Jarkko
- Reviews
- Tables
-
Tables in databases
Pick the data you need into tables, view the data as graphs, or download the data for your use.
Appendix tables
- Revisions in these statistics
-
- Revisions on these statistics (9.7.2015)
Updated 9.7.2015
Official Statistics of Finland (OSF):
Annual national accounts [e-publication].
ISSN=1798-0623. 2014. Helsinki: Statistics Finland [referred: 15.2.2026].
Access method: http://stat.fi/til/vtp/2014/vtp_2014_2015-07-09_tie_001_en.html

