Published: 15 March 2019
Gross domestic product grew by 2.3 per cent in 2018
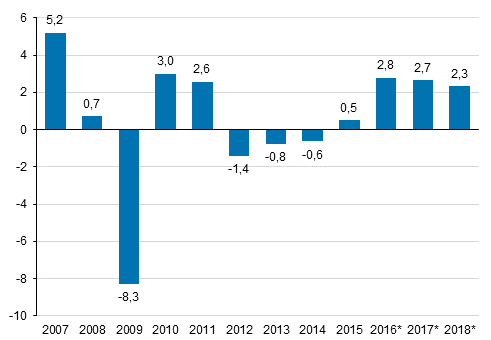
According to Statistics Finland’s preliminary data, the volume of Finland’s gross domestic product grew by 2.3 per cent in 2018. The growth rate became slightly revised from the data published at the end of February (was 2.2 per cent). The year 2018 was the third successive year when Finland's gross domestic product grew clearly. As a result of this growth, the volume of gross domestic product exceeded the top year 2008 prior to the financial crisis.
Annual change in the volume of gross domestic product, per cent

Demand and supply of the national economy
Of demand items, investments grew at current prices by 6.1 per cent and exports by 5.5 per cent in 2018. The biggest of demand items, that is, private consumption expenditure grew by 2.7 per cent to EUR 124.8 billion. The value of inventories grew strongly in 2018, but data on inventories are still preliminary in nature. Investments at current prices increased by 3.2 per cent and exports by 1.5 per cent. The prices of exports rose by four per cent.
Gross domestic product describing the output of the national economy, EUR 234 billion, was calculated at current prices 4.3 per cent higher than in 2017. The volume of gross domestic product grew by 2.3 per cent. In addition to domestic output, the total demand of the economy comprises imports, so the growth in imports reduces the need for growth in domestic output. The value of imports grew by 7.9 per cent in 2018. The volume of imports rose by 4.2 per cent and prices of import products went up by 3.5 per cent. The value of net exports of goods and services showed a deficit of EUR 1.3 billion. As export prices rose faster than import prices, the terms of trade effect directed to gross domestic product was positive.
General government deficit continued decreasing
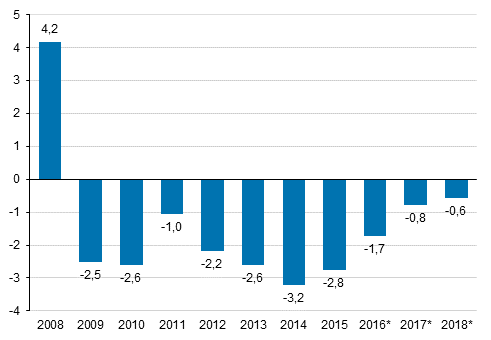
The financial position, or net lending, of general government showed a deficit of EUR 1.3 billion. In the previous year, the deficit was EUR 1.8 billion. The deficit amounted to 0.6 per cent relative to GDP. Statistics Finland will publish the deficit and debt data to be reported to the European Commission on 18 April 2019.
General government surplus / deficit relative to GDP, per cent

The deficit of central government was EUR 2.7 billion, while one year before it was EUR 4.1 billion. The growth in tax revenue particularly lowered the deficit. According to preliminary data, the deficit of local government (municipalities and joint municipal authorities, etc.) grew by EUR 1.8 billion.
The surplus of employment pension schemes grew from EUR 2.0 billion to EUR 2.5 billion, although the amount of pensions paid by employment pension schemes continued growing. The surplus does not include holding gains in assets. Other social security funds showed a surplus of EUR 0.7 billion.
General government's share of the gross value added was 18.3 per cent in 2018, which is 0.3 percentage points more than in the year before.
Households’ savings ratio turned positive
Households' adjusted real income grew by 4.0 per cent. Adjusted income also takes into consideration welfare services, i.e. the individual services that general government and organisations produce for households, such as educational, health and social services.
Wages and salaries received by households grew in nominal terms by 4.6 per cent. Households’ consumption expenditure increased by three per cent and households’ saving turned EUR 0.7 billion positive (EUR -1.1 billion in 2017). The savings ratio was 0.6 per cent.
Release of annual national accounts data is advanced to June in 2019
We are reviewing the release of annual national accounts data from July to June. The summer data will be released on 20 June 2019. At the same time, we will produce data concerning the previous year with a renewed data content.
Source: National Accounts 2018, preliminary data. Statistics Finland
Inquiries: Tapio Kuusisto 029 551 3318, Jarkko Kaunisto 029 551 3551, kansantalous@stat.fi
Director in charge: Ville Vertanen
Publication in pdf-format (240.4 kB)
- Tables
-
Tables in databases
Pick the data you need into tables, view the data as graphs, or download the data for your use.
Appendix tables
Updated 15.3.2018
Official Statistics of Finland (OSF):
Annual national accounts [e-publication].
ISSN=1798-0623. 2018. Helsinki: Statistics Finland [referred: 13.2.2026].
Access method: http://stat.fi/til/vtp/2018/vtp_2018_2019-03-15_tie_001_en.html

