Published: 31 January 2020
Gross domestic product grew by 1.7 per cent in 2018
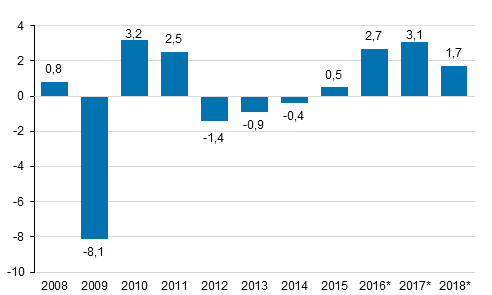
According to Statistics Finland’s preliminary data, the volume of Finland’s GDP grew by 1.7 per cent in 2018 from the year before. The data became revised mainly as regards the economy and financing. A more extensive update to the 2018 data will be made on 16 March. Value added in the environmental goods and services sector was eight per cent of the value added of the national economy.
Annual change in the volume of gross domestic product, per cent

At the same time, the final figures for 2015 were published. The volume growth for GDP in 2015 was revised to 0.5 per cent (previously 0.6) as a result of balancing the supply and demand of the national economy. Minor updates were also made for the years 2016 and 2017.
Supply
The current price value of value added grew by 3.6 per cent in 2018 and totalled EUR 202 billion. The value of taxes on products was EUR 33 billion and the value of product subsidies was EUR 0.9 billion. The value of gross domestic product calculated from these items was EUR 234 billion.
The 8.6 per cent increase in the value of imports to EUR 92 billion boosted total supply. The volume of imports went up by five per cent.
Demand
The value of exports increased by 6.3 per cent to EUR 90 billion. The volume of exports grew by 2.2 per cent as the prices of export products rose by 4.0 per cent.
The biggest demand item, private consumption expenditure, increased by three per cent to EUR 124 billion. The value of government consumption expenditure grew by 3.3 per cent to EUR 53 billion.
The current price value of investments increased by 5.5 per cent to EUR 55 billion. The volume of investments increased by 3.2 per cent. Building investments were particularly growing. The change in inventories, EUR 3.0 billion, was exceptionally high in 2018. The change in inventories grew most in the manufacturing of pulp, paper, paper board and cardboard and in the building of ships and boats.
Data for 2018 will be released in March with detailed industry classification accuracy, when we obtain revised annual data from enterprises as sources.
Revised annual data on national accounts for the statistical reference year 2018 will be released on 16 March 2020. Before the March release, indicator-based data that more reliably describe output than intermediate consumption are used for one third of enterprise data for 2018. Two-thirds of enterprises’ value added has been calculated using preliminary data on enterprises’ annual data. Enterprises’ annual data also include data used for calculating intermediate consumption. Value added is calculated as the difference between output and intermediate consumption.
The data used for calculating investments will also become revised in March. Industry-specific data based on supplemented enterprise data for 2018 will be released on detailed industry level on 16 March 2020.
Quarterly national accounts are benchmarked to the new annual data for 2018 in connection with the March release, as a result of which the levels of indicator-based data for 2019 will also change.
Value added in the environmental goods and services sector eight per cent of the value added of the national economy
Part of the output of the national economy is included in the environmental goods and services sector. It describes economic activities that impose less loading on the environment than usual activities or save more natural resources. The environmental goods and services sector made up eight per cent of the value added of the whole national economy in 2018. The share has remained at the same level over the past few years.
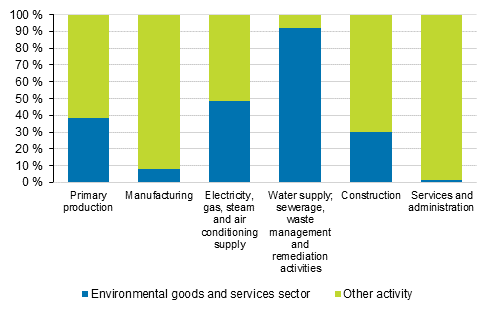
Industry shares of value added in the environmental goods and services sector in 2018

Of industries, water supply and waste management are counted almost entirely in the environmental goods and services sector. In energy supply the share of the environmental goods and services sector is nearly one half and in primary production around 40 per cent of the industry. In construction the environmental goods and services sector covers around 30 per cent and in manufacturing close on 10 per cent. In the service industries the share is very small, including such as nature tourism and environmental planning. Actual public administration does not include the environmental goods and services sector. The environmental goods and services sector in energy supply is mostly based on renewable energy sources. The share in primary production comes from sustainable forestry and organic agricultural production. In construction, the environmental goods and services sector most of all includes low energy construction.
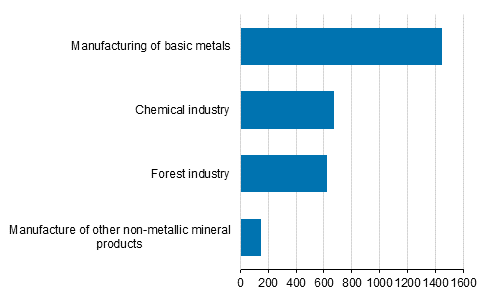
Construction is the industry with the biggest value added in the environmental goods and services sector. The next biggest industry is manufacturing. The environmental goods and services sector in its biggest sub-industry, the metal industry, contains especially production based on the use of recycled materials. The production of biofuels is particularly visible in the chemical industry. Most of the environmental goods and services sector in the forest industry is based on renewable energy produced and sold by plants.
Environmental goods and services sector in manufacturing in 2018, EUR million

More detailed information on the environmental goods and services sector is available on https://www.stat.fi/til/ylt/index_en.html .
Source: National Accounts 2018, Statistics Finland
Inquiries: Kansantalouden tilinpito: Tapio Kuusisto 029 551 3318, Ympäristöliiketoiminta: Sami Hautakangas 029 551 3791, kansantalous@stat.fi
Director in charge: Ville Vertanen
Publication in pdf-format (253.5 kB)
- Tables
-
Tables in databases
Pick the data you need into tables, view the data as graphs, or download the data for your use.
Appendix tables
- Revisions in these statistics
-
- Revisions on these statistics (31.1.2020)
Updated 31.1.2020
Official Statistics of Finland (OSF):
Annual national accounts [e-publication].
ISSN=1798-0623. 2018. Helsinki: Statistics Finland [referred: 10.2.2026].
Access method: http://stat.fi/til/vtp/2018/vtp_2018_2020-01-31_tie_001_en.html

