Published: 16 December 2016
Construction is the biggest industry within the environmental goods and services sector
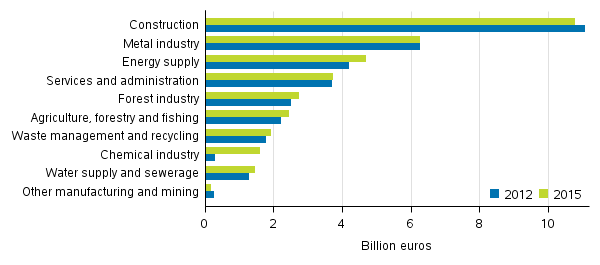
The value of Finland's environmental goods and services sector was nearly EUR 36 billion in 2015. The value added of the environmental goods and services sector was nearly EUR 12 billion and its GDP share was 5.7 per cent. The environmental goods and services sector employed 132,000 persons and its exports amounted to around EUR eight billion in 2015. The environmental goods and services sector was most engaged in construction, where its turnover was nearly EUR 10.8 billion. These data appear from Statistics Finland's renewed statistics on the environmental goods and services sector for the years 2012 to 2015. The statistics are connected to the EU Regulation on environmental economic accounts.
Turnover of the environmental goods and services sector by industry 2012 and 2015, billion euros

The environmental goods and services sector employed good 31,000 persons in construction in 2015. Of the environmental goods and services sector in construction, EUR 7.7 billion was related to heat and energy saving and management and to production of energy from renewable resources, and the remaining EUR 3.1 billion to wastewater management and waste management.
In the metal industry, the turnover of Finland's environmental goods and services sector was nearly EUR 6.2 billion in 2015. The activity employed nearly 15,000 persons. EUR 4.6 billion of the turnover in the metal industry were related to management of minerals. This refers to manufacturing which uses recycled metals as raw materials. The remainder was divided into several product categories of resource management and environmental protection.
The majority of the environmental goods and services sector, 84 per cent, was connected to resource management and just 16 per cent to environmental protection in 2015. The biggest product classes of resource management were heat and energy saving and management, with a turnover of EUR 10.8 billion, production of energy from renewable resources, EUR 7.2 billion, and management of minerals, with a turnover of EUR 5.0 billion. The biggest product classes of environmental protection were wastewater management with a turnover of EUR 2.9 billion and waste management with a turnover of EUR 1.8 billion.
The turnover of the environmental goods and services sector grew moderately by 6.7 per cent in 2012 to 2015. In contrast, value added grew by 13.1 per cent and exports by 16.7 per cent. Employment remain unchanged. The turnover from the product class of production of energy from renewable resources grew clearly the most, by 34.5 per cent in 2012 to 2015.
The production method of the statistics on the environmental goods and services sector has been completely revised. The statistics now cover all industries. The source data for the statistics are register data, statistical data and other available data. Data have been collected from Statistics Finland's national accounts, statistics on industrial output, structural business and financial statement statistics, statistics on production of electricity and heat, and statistics on energy use in manufacturing, and from Finnish Customs, the Natural Resources Institute Finland, the Energy Authority, the Finnish Environmental Insurance Centre, and the Housing Finance and Development Centre of Finland. In addition, data from many business organisations and other experts have been used in exploring the shares of the environmental goods and services sector. The concepts and definitions of the statistics are based on the EU Regulation (No 691/2011, 538/2014) on European environmental economic accounts and Eurostat's manuals. The new statistics are not comparable with the old statistics based on a sample inquiry. According to the Regulation on European environmental economic accounts, the data of the statistics must be reported to the EU by the end of 2017.
Source: Environmental goods and services sector 2015, Statistics Finland
Inquiries: Annika Miettinen 029 551 2747, Jukka Muukkonen 029 551 3224, ymparistoliiketoiminta@stat.fi
Director in charge: Ville Vertanen
Publication in pdf-format (249.4 kB)
- Tables
-
Tables in databases
Pick the data you need into tables, view the data as graphs, or download the data for your use.
Appendix tables
- Appendix table 1. Turnover of the environmental goods and services sector by industry 2012-2015, million euros (16.12.2016)
- Appendix table 2. Value added of environmental goods and services sector by industry 2012-2015, million euros (16.12.2016)
- Appendix table 3. Exports of environmental goods and services sector by industry 2012-2015, million euros (16.12.2016)
- Appendix table 4. Employment of environmental goods and services sector by industry 2012-2015, full time equivalent (16.12.2016)
- Appendix table 5. Turnover of the environmental goods and services sector by product classes 2012-2015, million euros (16.12.2016)
- Figures
Updated 16.12.2016
Official Statistics of Finland (OSF):
Environmental goods and services sector [e-publication].
ISSN=1799-5108. 2015. Helsinki: Statistics Finland [referred: 21.2.2026].
Access method: http://stat.fi/til/ylt/2015/ylt_2015_2016-12-16_tie_001_en.html

