Published: 14 December 2017
Construction grew most in the environmental goods and services sector
The turnover from Finland's environmental goods and services sector was EUR 36 billion in 2016. The value added of the environmental goods and services sector was EUR 12 billion, which was around six per cent of the value added of the entire national economy. The environmental goods and services sector employed 130,000 persons and its exports amounted to EUR seven billion in 2016. These data derive from Statistics Finland’s statistics on the environmental goods and services sector.
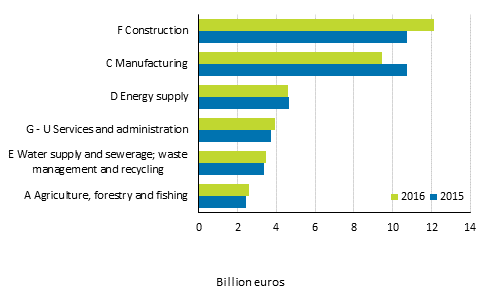
Turnover of the environmental goods and services sector by industry in 2015 and 2016, EUR billion

The turnover of the biggest industry of the environmental goods and services sector, construction, was over EUR 12 billion, which was one-third of the whole environmental goods and services sector. Construction employed good 33,000 persons and its value added was good EUR two billion.
The majority of the environmental goods and services sector, 84 per cent, was connected to resource management and just 16 per cent to environmental protection in 2016. The biggest product categories of resource management were heat and energy saving and management, with a turnover of EUR 12 billion, production of energy from renewable resources, EUR seven billion, and management of minerals, with a turnover of almost EUR five billion. The biggest product categories of environmental protection were waste water management with a turnover of EUR three billion and waste management with a turnover of EUR two billion.
The turnover from environmental goods and services sector increased by 1.4 per cent from 2015 to 2016. In turn, value added remained unchanged and exports went down by 11 per cent mainly due to the decreased exports of the metal industry’s environmental goods and services sector. Employment decreased by 1.1 per cent. The turnover of construction from the environmental goods and services sector grew by around 13 per cent compared with the previous year. The growth was primarily caused by the planning and construction costs of renewable energy power plants.
The concepts and definitions of the statistics are based on the EU Regulation (No 691/2011 and 538/2014) on European environmental economic accounts and Eurostat's manuals. Starting from the environmental goods and services sector 2015 release, the statistics are not comparable with the old statistics based on a sample inquiry.
Source: Environmental goods and services sector 2016, Statistics Finland
Inquiries: Susanna Kärkkäinen 029 551 3662, Sami Hautakangas 029 551 3791, ymparistotilinpito@tilastokeskus.fi
Director in charge: Ville Vertanen
Publication in pdf-format (235.3 kB)
- Tables
-
Tables in databases
Pick the data you need into tables, view the data as graphs, or download the data for your use.
Appendix tables
- Appendix table 1. Turnover of the environmental goods and services sector by industry 2012-2016, million euros (14.12.2017)
- Appendix table 2. Value added of environmental goods and services sector by industry 2012-2016, million euros (14.12.2017)
- Appendix table 3. Exports of environmental goods and services sector by industry 2012-2016, million euros (14.12.2017)
- Appendix table 4. Employment of environmental goods and services sector by industry 2012-2016, full time equivalent (14.12.2017)
- Appendix table 5. Turnover of the environmental goods and services sector by product classes 2012-2016, million euros (14.12.2017)
- Figures
Updated 14.12.2017
Official Statistics of Finland (OSF):
Environmental goods and services sector [e-publication].
ISSN=1799-5108. 2016. Helsinki: Statistics Finland [referred: 17.2.2026].
Access method: http://stat.fi/til/ylt/2016/ylt_2016_2017-12-14_tie_001_en.html

