Press release 28.2.2005
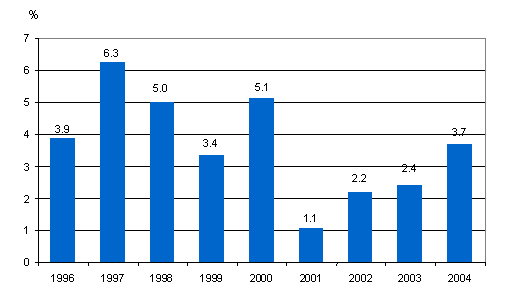
Gross domestic product grew by 3.7 per cent last year
According to Statistics Finland's preliminary data, the volume of Finland's gross domestic product grew by 3.7 per cent in 2004. Gross domestic product, or the combined value added of the goods and services produced, amounted to EUR 150 last year. In the first quarter of the year, output was 1.0 per cent greater than in the previous quarter, in the second quarter 0.8 and in the third quarter 1.1 per cent greater. During the last quarter of 2004, GDP increased by 0.6 per cent from the previous quarter.
Volume changes of GDP 1996-2004, %

Growth in demand hinged on households' consumption and private investments last year. Having contracted for the two previous years, fixed investments began to increase again. The volume of exports grew by 3.5 per cent and that of imports by just short of 5 per cent.
Private final consumption expenditure rose by over 3 per cent last year. Purchases of cars, which had continued brisk for two years, petered out in spring, but home appliances were bought in greater quantities that in the year before. Purchases of durable consumer goods went up by 4 per cent last year, whereas in the year before their purchases increased by as much as 19 per cent. Government consumption expenditure increased by 2 per cent.
Fixed investments increased by close on 5 per cent. Total investments in machinery, equipment and transport equipment grew by nearly 10 per cent. Compared with the previous year, investments in residential buildings increased by 8 per cent, but construction of other buildings fell by 5 per cent from twelve months back. Government investments contracted by one per cent.
The volume of exports of goods and services grew by 3.5 per cent and that of imports by 4.8 per cent. Import prices rose more than export prices so the terms of trade weakened by 1.7 per cent.
In the service industries, output increased by 3.5 per cent and in the processing industries by 4.4 per cent. Output went up by over 5 per cent in manufacturing and by good 2 per cent in construction. In primary production, output contracted by 2 per cent in both forestry and agriculture.
Operating surplus of non-financial corporations went up
The operating surplus of non-financial corporations went up by nearly 8 per cent last year. The growth accelerated clearly from the past few years and was the fastest since 2000. In business bookkeeping, profit roughly corresponds with operating surplus. Entrepreneurial income also grew faster than in recent years, by 14 per cent. Entrepreneurial income roughly corresponds with profit before payment of taxes and dividends. Non-financial corporations paid nearly 8 per cent more in direct taxes and 11 per cent more in dividends last year than in the year before. The value of non-financial corporations' fixed investments went up by 7 per cent last year. Despite the increased investments, the financial position of non-financial corporations remained good. Their net lending, depicting their financial position amounted to approximately EUR 7 billion and grew by 13 per cent from the previous year.
Households' real income grew by nearly five per cent
In 2004, the disposable income of households increased by 5.4 per cent in nominal terms and by 4.6 per cent in real terms. Gross income went up chiefly as a result of a 4.6 per cent growth in the wage sum. Dividend income of households increased by 26 per cent. Direct taxes went up by 1.8 per cent.
Final consumption expenditure of households grew by 4.1 per cent in nominal terms, i.e. slightly less than disposable income. The savings rate, that is, the proportion of savings relative to disposable income, was 1.9 per cent, having been 0.6 per cent twelve months earlier. Households' fixed investments grew by 9.5 per cent as housing investments continued strong.
General government surplus nearly EUR three billion
Central government continued to show a slight surplus of EUR 0.2 billion last year. State revenues from indirect taxes increased by just under 3 per cent, of which increase in value added tax revenues accounted for 4 per cent. Revenues from direct taxes grew by 4.3 per cent. Income transfers paid to local government grew by nearly 8 per cent.
The financial position of local government weakened and showed a deficit of around EUR 1 billion. The financial position showed a deficit for the fourth successive year. The growth in tax revenues received by municipalities amounted to barely 2 per cent.
The total EMU surplus of general government was 2.1 per cent of GDP in 2004. The EMU debt amounted to 45.1 per cent of GDP.
The proportion of public expenditure of GDP fell slightly and was 50.7 per cent in 2004, as against 50.9 per cent in the previous year. The tax rate, or the proportion of taxes and statutory social security contributions of GDP, declined last year to 44.1 per cent from 44.8 per cent in 2003.
Source: National Accounts, Preliminary data, Year
2004 and 4th quarter. Statistics Finland
General Government Deficit and Gross Debt according to the EMU
criteria. Statistics Finland
Inquiries: National Accounts: Mr Tuomas Rothovius,
+358 9 1734 3360, Mr Raimo Nurminen, +358 1734 3367;
General Government Deficit and Debt: Ms Paula Koistinen-Jokiniemi,
+358 1734 3362, skt.95@stat.fi
