Press release 19.3.2007
The Coalition Party recouped their loss in the previous elections
According to Statistics Finland's election analysis, support for the Coalition Party did not just grow in the strong areas of the Centre Party and the Social Democratic Party, but the party received steady support in different voting districts.
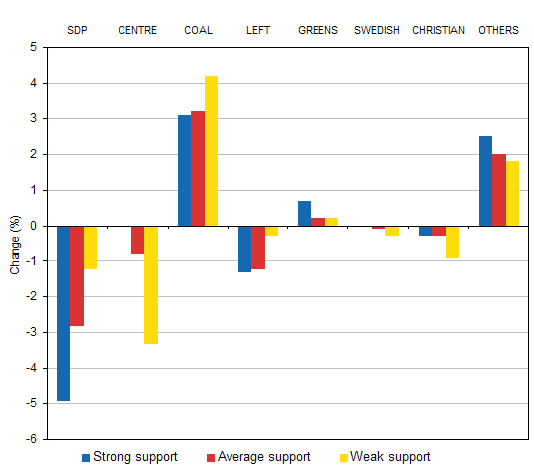
In the Parliamentary elections of 2003 the Coalition Party suffered a major defeat of 2.6 percentage points. In the 2003 elections the Coalition Party suffered the biggest losses in support in urban areas with a strong service industry, a high income level, few children and a low level of unemployment. <0} In the present elections the party won by a mile in these same areas. Correspondingly the Social Democratic Party lost a lot of votes in these areas. A part of the Coalition Party's success can therefore be attributed to the fact, that the traditional voters of the party renewed their support for it. The Coalition Party did, however, receive also particularly many new votes in the constituencies of Helsinki and Uusimaa as well as e.g. in the constituency of Oulu.
The Centre Party lost in its strong areas, where votes went to the Coalition Party and the True Finns. The party had poor success also in areas with high unemployment, a high proportion of pensioners and a low income level. The major part of these losses turned into support for the True Finns.
The success of the True Finns cannot, however, be explained simply by the votes won from the Centre Party. The Left Alliance lost many voters to the True Finns as well. The votes lost by the Left Alliance were not given to the Green league, as the Greens did not succeed in the conventionally strong areas of the Left Alliance.In this analysis, the True Finns are included in the group Others.
Changes in the support for parties in the strong, average and weak areas of the Social Democratic Party in the Parliamentary elections 2007 compared to the year 2003, percentage points

Source: Election Statistics, Parliamentary election 2007. Statistics Finland
Inquiries: Mr Risto Lättilä (09) 1734 3252,
vaalit.tilastokeskus@tilastokeskus.fi
Director in charge: Ms Marja Tammilehto-Luode
Links:
Start page of parliamentary
elections, tables
and reviews
Background
information on the candidates and elected MPs
