Published: 29 September 2016
Value added in manufacturing increased in 2015
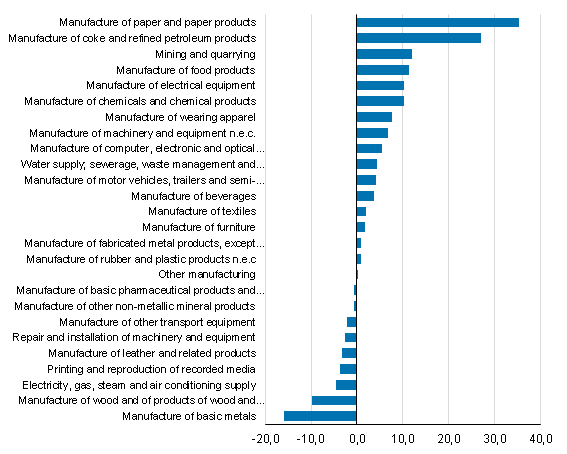
According to Statistics Finland’s preliminary data, the total gross value of all manufacturing (TOL BCDE) establishments was EUR 119.7 billion in 2015. The gross value of manufacturing remained on level with the previous year. However, value added increased by four per cent compared with the previous year and amounted to EUR 30.6 billion. The manufacturing industries that affected most the increase in value added were the manufacture of paper and paper products (TOL17) and the manufacture of coke and refined petroleum products (TOL19).
Change in value added in manufacturing in 2015*

* Preliminary data
Measured by value added the biggest regions were: Uusimaa, Varsinais-Suomi, Satakunta and Pirkanmaa. Their share in the entire value added of manufacturing was 53 per cent and 89 per cent of the growth in value added.
Value added in manufacturing by region in 2015*
| Region | Number of establishments | Value added 1000 € | R-on-year change, % |
| Uusimaa | 5 127 | 9 016 233 | 15,7 |
| Pirkanmaa | 2 957 | 2 887 882 | 4,0 |
| Varsinais-Suomi | 2 871 | 2 531 832 | -8,9 |
| Satakunta | 1 651 | 1 947 433 | -1,4 |
| Central Finland | 1 389 | 1 741 557 | 14,7 |
| North Ostrobothnia | 1 769 | 1 706 190 | -12,3 |
| Ostrobothnia | 1 167 | 1 613 013 | -3,5 |
| Päijät-Häme | 1 177 | 1 244 343 | 0,0 |
| Lapland | 964 | 1 140 536 | -5,5 |
| South Karelia | 640 | 1 085 579 | 11,4 |
| Kymenlaakso | 868 | 1 047 905 | 23,4 |
| Pohjois-Savo | 1 251 | 955 421 | -16,9 |
| South Ostrobothnia | 1 795 | 874 282 | -9,6 |
| Kanta-Häme | 942 | 846 502 | 0,3 |
| North Karelia | 885 | 838 793 | -1,7 |
| Etelä-Savo | 887 | 553 585 | 62,1 |
| Cenrtal Ostrobothnia | 439 | 351 559 | 519,6 |
| Kainuu | 366 | 153 021 | 46,5 |
| Åland | 182 | 96 054 | 12,5 |
| Unknown | 85 | 2 283 | 519,6 |
| Total | 27 412 | 30 634 094 | 4,0 |
The gross value of production measures the actual production output of an establishment. Operating activities include all production output, also production for own use and production for the enterprise’s other establishments. Gross value excludes transfer gains from fixed assets, which are not seen as a production item but as windfall profit. Additionally, the purchases of goods for resale are deducted from the profits of operating activities, so that operating activities only include the margin created by sales of goods for resale.
The value added measures the total value added produced by the various factors of production in an establishment’s actual operating activities. The value added is calculated by deducting the costs of operating activities from the income from the activities. Profits include also deliveries from an establishment to the enterprise's other establishments, and costs include also purchases from the enterprise’s other establishments. According to the definition, costs exclude the costs related to the establishment's personnel.
Regional statistics on entrepreneurial activity include data about the establishments of enterprises operating in Finland by industry, area and size category. The statistical data are released twice a year in September and December. The preliminary statistics that are published in the autumn have a less extensive content and focus on manufacturing industries, that include TOL B Mining and quarrying, TOL C Manufacturing, TOL D Electricity, gas and water supply, TOL E Water supply; sewerage, waste management and remediation activities.
Source: Regional statistics on entrepreneurial activity 2015, Statistics Finland
Inquiries: Merja Kiljunen 029 551 3284, rakenne.tilastot@stat.fi
Director in charge: Mari Ylä-Jarkko
Publication in pdf-format (204.0 kB)
- Tables
-
Tables in databases
Pick the data you need into tables, view the data as graphs, or download the data for your use.
Updated 29.9.2016
Official Statistics of Finland (OSF):
Regional statistics on entrepreneurial activity [e-publication].
ISSN=2342-6268. 2015. Helsinki: Statistics Finland [referred: 4.2.2026].
Access method: http://stat.fi/til/alyr/2015/alyr_2015_2016-09-29_tie_001_en.html

