

Published: 27 September 2019
Prices of old dwellings in housing companies rose in August in Greater Helsinki
According to Statistics Finland's preliminary data, prices of old dwellings in housing companies rose by 2.2 per cent in Greater Helsinki in August 2019 compared to August 2018 and decreased by 1.7 per cent in the rest of Finland.
Development of prices of old dwellings in housing companies by month, index 2015=100
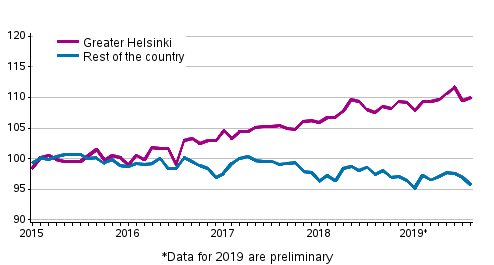
Compared with July, prices rose by 0.5 per cent in Greater Helsinki and decreased by 1.1 per cent elsewhere in Finland.
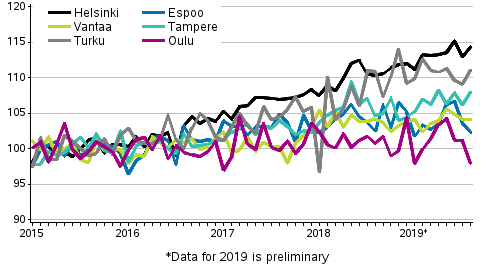
According to preliminary data, among large cities, prices went up compared with the corresponding period of last year, by 3.7 per cent in Helsinki, by 3.2 per cent in Tampere and in Turku prices remained unchanged. Compared with 2015, prices have risen by 14 per cent in Helsinki, by 11 per cent in Turku and by eight per cent in Tampere. The development of prices should always be examined in a longer period than one month (figure).
Development of prices of old dwellings in housing companies by month in large cities in 2015 to 2019M08
The average price per square metre of an old dwelling in a block of flats was EUR 4,708 in Helsinki, EUR 1,935 in Turku and EUR 2,543 in Tampere.
According to data available to Statistics Finland, 37,693 transactions of old dwellings in housing companies were made in the whole country in January to August, which is at last year’s level. (Appendix table 3).
Prices per square metre of old dwellings in housing companies, August 2019 1)
| Area | Price, EUR/m� | Index 2015=100 | Monthly change, % | Yearly change, % |
| Whole country | 2,140 | 102.5 | -0.3 | 0.3 |
| Greater Helsinki | 3,784 | 110.0 | 0.5 | 2.2 |
| Rest of the country (whole country - Greater Helsinki) | 1,654 | 95.8 | -1.1 | -1.7 |
| Satellite municipalities 2) | 2,049 | 95.2 | -1.4 | -3.2 |
| Helsinki | 4,377 | 114.4 | 1.2 | 3.7 |
| Espoo-Kauniainen | 3,476 | 102.3 | -1.2 | -0.2 |
| Vantaa | 2,744 | 104.1 | -0.0 | -0.1 |
| Tampere | 2,449 | 108.0 | 1.7 | 3.2 |
| Turku | 2,088 | 111.1 | 1.8 | 0.2 |
| Oulu | 1,772 | 97.9 | -3.1 | -2.8 |
2) Satellite municipalities = Hyvink��, J�rvenp��, Kerava, Kirkkonummi, Nurmij�rvi, Riihim�ki, Sipoo, Tuusula and Vihti
When the monthly statistics on prices of dwellings in housing companies are published, they cover approximately 50 per cent of all transactions made in the latest statistical reference month. The monthly data become revised during the following months so that the final data for the year are published in the release concerning the first quarter of the following year. Further information about data revisions can be found in separate tables. It is not recommended to use the latest month’s number of transactions when describing the activeness of trading.
Source: Prices of dwellings in housing companies, Statistics Finland
Inquiries: Petri Kettunen 029 551 3558, Elina Vuorio 029 551 3385, asuminen.hinnat@stat.fi
Director in charge: Mari Yl�-Jarkko
Publication in pdf-format (340.4 kB)
- Tables
-
Tables in databases
Pick the data you need into tables, view the data as graphs, or download the data for your use.
Appendix tables
- Appendix table 1. Unencumbered average prices per square metre of old blocks of flats, August 2019 1) (27.9.2019)
- Appendix table 2. Unencumbered average prices per square metre of old terraced houses, August 2019 1) (27.9.2019)
- Appendix table 3. Number of known transactions of old dwellings in housing companies in the early part of the year (27.9.2019)
- Quality descriptions
- Revisions in these statistics
-
- Revisions in these statistics (27.9.2019)
Updated 27.9.2019
Official Statistics of Finland (OSF):
Prices of dwellings in housing companies [e-publication].
ISSN=2323-8801. August 2019. Helsinki: Statistics Finland [referred: 21.7.2026].
Access method: http://stat.fi/til/ashi/2019/08/ashi_2019_08_2019-09-27_tie_001_en.html