

Managers’ earnings have developed fastest in this decade
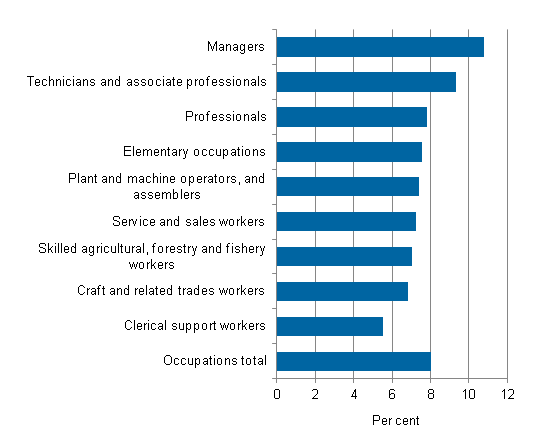
The change in earnings standardised with the main category of occupation has developed fastest in the occupational groups of managers and associate professionals and slowest in the occupational group of clerical support workers in 2010 to 2013. When the change percentages for earnings are studied for the years 2010 to 2013 in total, managers' earnings have risen by 10.8 per cent, associate professionals' by 9.3 per cent and clerical support workers' earnings by 5.6 per cent (Figure 1).
Figure 1. Change in earnings in 2010 to 2013, according to the index for regular earnings standardised with occupational structure, employer sectors total
Statistics Finland published for the first time the statistics describing the effects of changes in occupational structure in October 2013. A new index was developed for the statistics based on the index for regular earnings 2010=100, where the shares of the main categories of occupation for the wage and salary earner group of each index were standardised. There are ten of these main categories, from managers to other workers. Data on earnings development standardised with the category of occupation are released once a year.
Earnings development in different main categories of occupation varies by sector
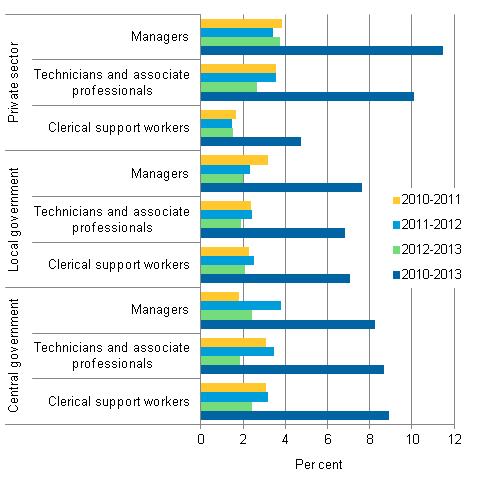
When the changes are viewed by employer sector, the fast development of earnings of managers and associate professionals and the slow development of clerical support workers become particularly emphasised in the private sector (Figure 2). For managers, the change in earnings in 2010 to 2013 was in the private sector 11.5 per cent, in the local government sector 7.6 per cent, and in the central government sector 8.2 per cent. For clerical support workers, the change in earnings in 2010 to 2013 was in the private sector 4.8 per cent, in the local government sector 7.1 per cent, and in the central government sector 8.9 per cent.Figure 2. Change in earnings in 2010 to 2013 according to the index standardised with the main category of occupation
Change in occupational structure raises average earnings in central and local government sectors
From 2010 to 2013, the change in the occupational structure has accelerated the rise in average earnings both in the central and local government sectors. For example, in the occupational groups of professionals and managers, wage and salary earners usually have a higher university degree, and in these occupations, the earnings level is also higher than average. The growing share of these occupations leads to a faster rise in average earnings. This is most clearly visible in the earnings development of central and local government sectors, in particular. Figure 3 shows how the index for regular earnings has risen more in the central and local government sectors in 2010 to 2013 than the index standardised with occupation, where the effect of the change in occupational structure on the rise in average earnings has been eliminated.Figure 3. Change in earnings in 2010 to 2013 by employer sector and according to the index for regular earnings and the index standardised with the main category of occupation
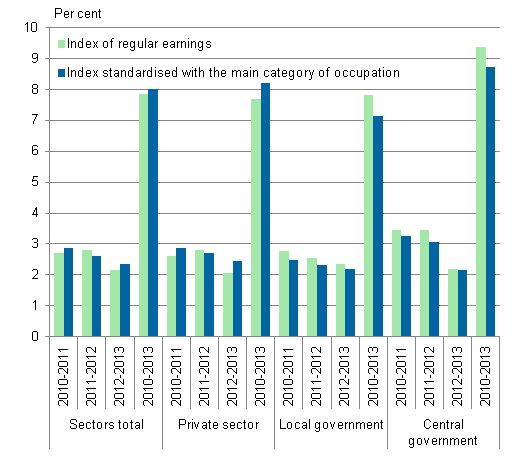
The development has varied in the private sector. The occupation-standardised index has risen in total more than the index for regular earnings in 2010 to 2013. When examining the annual development in the private sector, it can be seen in the figure that in 2011 to 2012 the index for regular earnings has risen more than the index standardised with occupation and the situation has been opposite in 2010 to 2011 and 2012 to 2013.
The development in the private sector is explained by that the share of the occupational group of managers has fallen in 2010 to 2013. Because the average regular earnings of managers are higher than average regular earnings in occupational groups in total, the fall in the share of managers means the rise in average earnings in the private sector having slowed down. On the other hand, the share of the occupational group of service and sales workers has grown in the private sector in 2010 to 2013. However, average regular earnings in this occupational group are lower than average regular earnings in occupational groups in total. For this reason, the growth in the share of service and sales workers also denotes that the rise in average earnings in the private sector has decelerated. Because the research data concern only a short period, it is not possible to draw any conclusions based on them on the long-term effects of the change in occupational structure in the private sector.
Employer sector-specific data on the index standardised with the main category of occupation can be found in the database table of the Index of wage and salary earnings (Index of regular earnings 2010=100 fixed by the main category of occupations).
Source: Index of wage and salary earnings 2014, 2nd quarter. Statistics Finland
Inquiries: Anu Uuttu 029 551 2322, Harri Nummila 029 551 3235, palkat.indeksit@stat.fi
Director in charge: Hannele Orjala
Updated 27.8.2014
Official Statistics of Finland (OSF):
Index of wage and salary earnings [e-publication].
ISSN=1798-7814. 2nd quarter 2014,
Managers’ earnings have developed fastest in this decade
. Helsinki: Statistics Finland [referred: 26.7.2026].
Access method: http://stat.fi/til/ati/2014/02/ati_2014_02_2014-08-27_kat_001_en.html