

Published: 24 March 2014
Total energy consumption fell by 2 per cent last year
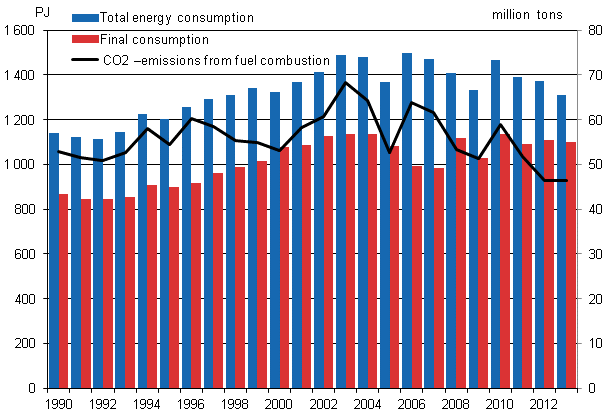
According to Statistics Finland’s preliminary data, total energy consumption in 2013 amounted to approximately 1,341 PJ (petajoule), or around 373 TW (terawatt hours), which was more than two per cent less than in 2012. Of energy sources, the use of peat declined most, by over 25 per cent. The decrease in the availability of hydro power and net imports of electricity increased the use of coal by 17 per cent. The warm latter part of the year diminished consumption of heating energy. According to preliminary data for 2013, the share of renewable energy in total energy consumption diminished.
Total energy consumption, final consumption and carbon dioxide emissions 1990–2013*
The use of wood fuel went down by over two per cent. The use of nuclear energy, wind power and recycled fuels grew last year. The share of wind power was 0.2 per cent of total energy consumption.
Consumption of electricity amounted to 83.9 TWh, down by 1.5 per cent year-on-year. Close on 19 per cent of the electricity consumed in Finland was covered with imported electricity. Net imports of electricity to Finland went down by ten per cent. Imports of electricity from the Nordic markets decreased by 15 per cent. Last autumn, a small amount of electricity was exported for the first time to Russia.
Diverse energy products were imported to Finland to the value of around EUR 13.8 billion in 2013, which was three per cent more than in 2012. Correspondingly, energy products were exported from Finland to the value of nearly EUR 7.0 billion, which was over ten per cent more than one year previously. Imports of energy products from Russia accounted for 66 per cent. In December, stocks of coal amounted to some 26 TWh, which was over 33 per cent less than one year earlier. Stocks of peat amounted to around 17.6 TWh in December, or some 137 per cent more than the year before. It is estimated that more energy peat will remain in stocks this spring 2014 than in the previous years.
Carbon dioxide emissions from the production and use of energy remained unchanged in 2013. The use of coal increased carbon dioxide emissions and the lower use of oil, natural gas and peat decreased them.
Total energy consumption by source (TJ) and CO2 emissions (Mt)
| Energy source, TJ 4) | 2013* | Annual change-%* | Percentage share of total energy consumption* |
| Oil | 314,478 | -3 | 23 |
| Coal 1) | 146,804 | 17 | 11 |
| Natural gas | 107,057 | -7 | 8 |
| Nuclear energy 2) | 247,618 | 3 | 18 |
| Net imports of electricity 3) | 56,574 | -10 | 4 |
| Hydro and wind power 3) | 48,574 | -21 | 4 |
| Peat | 48,652 | -25 | 4 |
| Wood fuels | 324,000 | -2 | 24 |
| Others | 47,687 | 7 | 4 |
| TOTAL ENERGY CONSUMPTION | 1,341.443 | -2 | 100 |
| Bunkers | 45,456 | 47 | . |
| CO2 emissions from energy sector | 46 | 0 | . |
2) Conversion of electricity generation into fuel units: Nuclear power: 10.91 TJ/GWh (33% total efficiency)
3) Conversion of electricity generation into fuel units: Hydro power, wind power and net imports of electricity: 3.6 TJ/GWh (100%)
4) *Preliminary
Source: Statistics Finland, Energy supply and consumption
Inquiries: Pentti Wanhatalo 09 1734 2685, energia@stat.fi
Director in charge: Leena Storg�rds
Publication in pdf-format (530.3 kB)
- Tables
-
Tables in databases
Pick the data you need into tables, view the data as graphs, or download the data for your use.
- Figures
-
- Appendix figure 1. Changes in GDP, Final energy consumption and electricity consumption (24.3.2014)
- Appendix figure 2. Carbon dioxide emissions from fossil fuels and peat use (24.3.2014)
- Appendix figure 3. Coal consumption (24.3.2014)
- Appendix figure 4. Consumption of natural gas (24.3.2014)
- Appendix figure 5. Peat consumption (24.3.2014)
- Appendix figure 6. Domestic oil deliveries (24.3.2014)
- Appendix figure 7. Share of total energy consumption 2012 - 2013* (24.3.2014)
- Appendix figure 8. Total energy consumption 1975 - 2013* (24.3.2014)
- Appendix figure 9. Fossil fuels and renewables 1970 - 2013* (24.3.2014)
- Appendix figure 10. Electricity supply 1970 - 2013* (24.3.2014)
- Appendix figure 11. Energy and electricity intensity 1970 - 2013* (24.3.2014)
- Appendix figure 12. Imports and exports of electricity 1990 - 2013* (24.3.2014)
- Appendix figure 13. Share of renewables of total primary energy 2013* Corrected on 8 September 2014 (24.3.2014)
- Appendix figure 14. Final energy consumption by sector 2013* (24.3.2014)
- Appendix figure 15. Final energy consumption by sector 2012 and 2013* (24.3.2014)
- Appendix figure 16. Total energy consumption and final energy consumption 1970 - 2013* (24.3.2014)
- Appendix figure 17. Electricity supply 2012 - 2013* (24.3.2014)
- Appendix figure 18. Production of district heat 1970 - 2013* (24.3.2014)
- Appendix figure 19. Electricity generation capacity in peak load period in the beginning of the year 2013 (24.3.2014)
- Appendix figure 20. Electricity consumption by sector 1980 - 2013* (24.3.2014)
- Appendix figure 21. Renewable energy as a proportion of final energy consumption in 2012, and the target for 2020 (24.3.2014)
- Appendix figure 22. Electricity consumption by sector 2013* (24.3.2014)
- Appendix figure 23. Finlands greenhouse gas emissions 1990 - 2013* (24.3.2014)
- Revisions in these statistics
-
- Revisions in these statistics (24.3.2014)
Updated 24.3.2014
Official Statistics of Finland (OSF):
Energy supply and consumption [e-publication].
ISSN=1799-7976. 4th quarter 2013. Helsinki: Statistics Finland [referred: 24.6.2026].
Access method: http://stat.fi/til/ehk/2013/04/ehk_2013_04_2014-03-24_tie_001_en.html