Published: 30 September 2021
Energy consumption in manufacturing and households fell in 2019
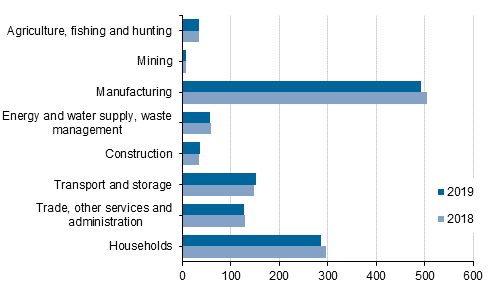
The final consumption of energy products used by Finns in Finland and abroad fell by 1.6 per cent from the previous year to 1,192 petajoules in 2019. The fall was most significant for households and manufacturing, where final energy consumption was three per cent lower than one year earlier. Households consumed 286 petajoules of energy, which corresponded to one-quarter of total final consumption. The share of manufacturing in total final consumption stood at around 40 per cent. Service industries used close on one-quarter of energy, the biggest final user being transportation and storage.
Final consumption of energy by industry in 2018 and 2019, petajoule

As regards fuels, the fall was particularly visible in the use of hard coal, the use of which in energy production went down by 22 per cent from last year. The use of peat also fell by eight per cent from the previous year. However, the decrease in the use of fossil fuels was not wholly visible as lower energy use, as part of it was replaced with renewable energy. The consumption of wood fuels went up by one per cent from the year before.
Households' final energy consumption fell by 3.3 per cent, which was particularly visible as a decrease in the consumption of transport fuels and electricity and heat. Households’ consumption of wood was also lower than last year. The change is partly explained by the warmer year that decreased the need for heating.
In manufacturing, final energy consumption went down by 2.7 per cent, which was visible as a decrease in the use of coal and coal products in the manufacture of basic metals. In turn, final energy consumption grew by 1.3 per cent in service industries from the year before. Growth was particularly seen in transportation and storage, where the consumption of fuels used in transport increased by 3.2 per cent from one year ago.
Electricity consumption fell by 1.7 per cent from the year before to 318 petajoules. The consumption of electricity in manufacturing was 1.5 per cent lower than in 2018. Manufacturing used 43 per cent of all consumed electricity. Electricity consumption also declined in service industries by 1.6 per cent from the previous year.
Consumption of energy products by industry in 2019, TJ
| Hard coal and peat products | Oil products | Bio fuels | Other fuels (inc. waste) | Electrical energy | Heat | Total | |
| Agriculture, forestry and fishing | 2 111 | 18 602 | 7 545 | 47 | 5 312 | 592 | 34 209 |
| Mining and quarrying | . | 2 176 | 83 | 3 | 5 188 | 196 | 7 646 |
| Forest industry | 7 855 | 5 539 | 174 414 | 187 306 | 68 312 | 20 697 | 464 123 |
| Oil refining and manufacture of chemicals | 37 695 | 213 746 | 19 835 | 572 487 | 25 059 | 17 908 | 886 730 |
| Other industries | 46 236 | 9 573 | 991 | 10 268 | 45 039 | 19 047 | 131 154 |
| Energy management | 103 465 | 11 350 | 147 363 | 322 541 | 19 519 | 37 941 | 642 179 |
| Water supply and waste management | 3 | 34 | 107 | 30 | 1 737 | 99 | 2 010 |
| Construction | . | 32 670 | 1 439 | 1 | 1 761 | . | 35 871 |
| Transport and storage | 4 | 135 167 | 8 539 | 368 | 5 774 | 1 812 | 151 664 |
| Trade, other services and administration | 94 | 18 239 | 5 213 | 1 056 | 59 137 | 43 401 | 127 140 |
| Households | 157 | 78 659 | 57 648 | 1 551 | 81 408 | 66 751 | 286 174 |
| TOTAL | 197 620 | 525 755 | 423 177 | 1 095 658 | 318 246 | 208 444 | 2 768 900 |
Energy accounts are part of the second stage of the European Union’s Regulation concerning environmental accounts that became legally valid in June 2014 ((EC) No 538/2014). The Regulation obliges the Member States to compile statistics and report annually on energy accounts.
The goal of environmental accounts is to describe the interaction between the environment and the economy by mainly using the same basic concepts and classifications as national accounts (ESA 2010). In the energy accounts, the supply and use of energy are presented in accordance with the industrial classification and domicile principle used in national accounts. Thus, the data of the statistics can be connected to various monetary variables of national accounts, such as total output and value added. The energy accounts’ data on the supply and use of energy can also be combined with the data of the statistics on environmental taxes and emissions into air by industry.
Unlike other statistics on energy, energy accounts also contain the supply and consumption of energy by Finns abroad, in accordance with the framework of national accounts. Correspondingly, the supply and consumption of energy by foreigners within Finland are subtracted from energy accounts. Unlike in the national accounts, statistics describing the physical flows of environmental accounts, including the energy accounts, do not take into consideration global factoryless production and merchanting.
Source: Energy Accounts 2019, Statistics Finland
Inquiries: Juuso Peltola 029 551 2330, ymparistotilinpito@stat.fi
Head of Department in charge: Katri Kaaja
Publication in pdf-format (167.6 kB)
- Tables
-
Tables in databases
Pick the data you need into tables, view the data as graphs, or download the data for your use.
Updated 30.9.2021
Official Statistics of Finland (OSF):
Energy Accounts [e-publication].
ISSN=2489-5741. 2019. Helsinki: Statistics Finland [referred: 21.1.2026].
Access method: http://stat.fi/til/entp/2019/entp_2019_2021-09-30_tie_001_en.html

