

Published: 5 June 2019
European Parliament elections 2019, result of the control calculation
The election result did not change in the control calculation. The National Coalition Party became the largest party in the European Parliament elections with 20.8 per cent of the votes. In relative terms, the Green League increased its support most compared with the previous European Parliament elections, by 6.7 percentage points. In relative terms, the Centre Party lost most votes, the party’s share of votes was 6.2 percentage points lower than in the previous European Parliament elections. Detailed election results can be found in Statistics Finland's PX-Web database service .
Support for parties in the European Parliament elections in 2009 to 2019, %
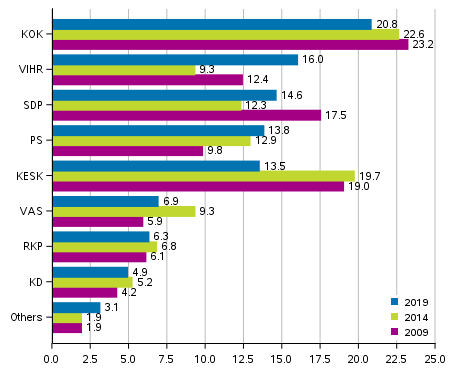
Among the major parties, the Green League, the Social Democratic Party and the Finns Party increased their support. Unlike in the Parliamentary elections, the difference in support between the largest party in the elections to the second largest was clear, 4.8 percentage points. By contrast, the differences in the support for the Green League, the Social Democratic Party, the Finns Party and the Centre Party were smaller, at most 2.5 percentage points. The National Coalition Party, the Centre Party, the Left Alliance, the Swedish People's Party and the Christian Democrats all lost support compared with the previous European Parliament elections. Groups outside the Parliamentary parties received 3.1 per cent of the votes, 1.2 percentage points more than in the previous elections.
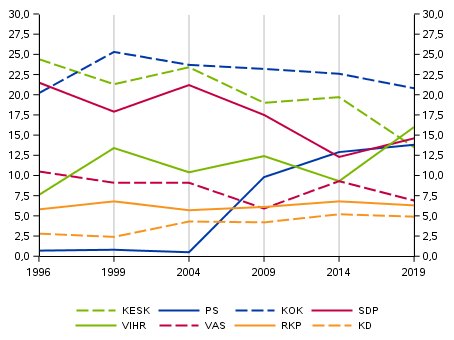
Support for parties in the European Parliamentary elections in 1996 to 2019, %
Seven parties got representatives to the European Parliament. The National Coalition Party got three seats in the European Parliament and maintained its number of seats. The Green League, the Social Democratic Party, the Finns Party and the Centre Party each got two seats. The Green League gained one seat, the Social Democratic Party and the Finns Party maintained their seats, and the Centre Party lost one seat. The Left Alliance and the Swedish People's Party both got one seat and there was no change in their number of seats. Of the parliamentary parties, the Christian Democrats did not get a seat in the European Parliament.
Votes cast for the largest parties and seats in the European Parliament elections 2019, 2014, 2009 and 2004
| Party | 2019 votes |
2014 votes |
2009 votes |
2004 votes |
2019 places |
2014 places |
2009 places |
2004 places |
| National Coalition Party KOK |
380,460 | 390,376 | 386,416 | 392,771 | 3 | 3 | 3 | 4 |
| Green League VIHR |
292,892 | 161,263 | 206,439 | 172,844 | 2 | 1 | 2 | 1 |
| Finnish Social Democr. Party SDP |
267,603 | 212,781 | 292,051 | 350,525 | 2 | 2 | 2 | 3 |
| Finns Party PS |
253,176 | 222,457 | 162,930 | 8,900 | 2 | 2 | 1 | 0 |
| Centre Party of Finland KESK |
247,477 | 339,895 | 316,798 | 387,217 | 2 | 3 | 3 | 4 |
| Left Alliance VAS |
126,063 | 161,074 | 98,690 | 151,291 | 1 | 1 | 0 | 1 |
| Swedish People's Party in Finland RKP |
115,962 | 116,747 | 101,453 | 94,421 | 1 | 1 | 1 | 1 |
| Christian Democrats in Finland KD |
89,204 | 90,586 | 69,458 | 70,845 | 0 | 0 | 1 | 0 |
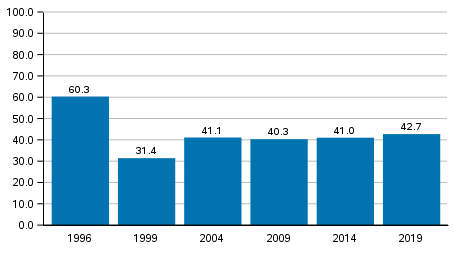
The voting percentage of persons entitled to vote living in Finland was 42.7, which was 1.7 percentage points higher than in the previous European Parliament elections. In all, 42.0 per cent of men and 43.4 per cent of women eligible to vote voted. The voting percentage was highest in the constituency of Helsinki (55.8%) and lowest in the constituency of Savo-Karelia (36.4%). Among municipalities, the voting percentage was lowest in Hyrynsalmi (29.2%) and highest in Kauniainen (69.9%).
Voting turnout in the European Parliament elections in 1996 to 2019, persons entitled to vote living in Finland
Party analysis
The party analysis examines parties’ results in the European Parliament elections in 2019 with the help of various background variables in classified areas.
The background variables used in the analysis are the area’s economic structure, degree of urbanisation, income level, unemployment rate and the number of pensioners. The background variables used are not mutually exclusive. For example, the area’s industrial structure and degree of urbanisation also partially describe the area’s income level.
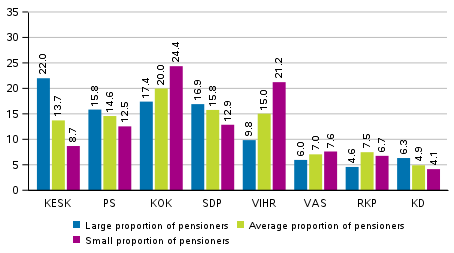
Support for the Centre Party was highest in areas where pensioners’ share of the population is big. Support for the Finns Party, the Social Democratic Party and the Christian Democrats focused to some extent on areas where they were more pensioners than on average. Correspondingly, the support for the National Coalition Party and the Green League, and in lesser extent also the Left Alliance, focused on areas where the share of pensioners in the population was lower than average.
Support for the parties in the European Parliament elections 2019 by the number of pensioners in specific geographical regions, %
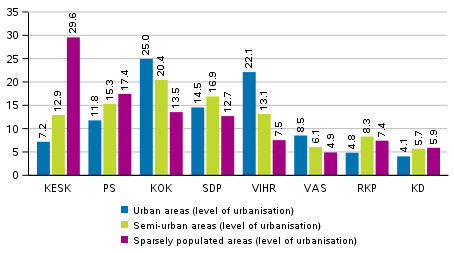
Support for the Centre Party focused clearly on sparsely-populated areas, the difference in the party’s support in sparsely-populated areas compared to population centres and especially urban areas was considerable, Support for the Finns Party was also highest in sparsely-populated areas, the difference to other areas grouped by the degree of urbanisation was, however, clearly smaller than for the Centre Party. Measured by the degree of urbanisation, the support profile for the National Coalition Party, the Green League and the Left Alliance is similar, being highest in urban areas. By contrast, the support for the Social Democratic Party was highest in population centres.
Support for the parties in the European Parliament elections 2019 by areas specified by population density, %
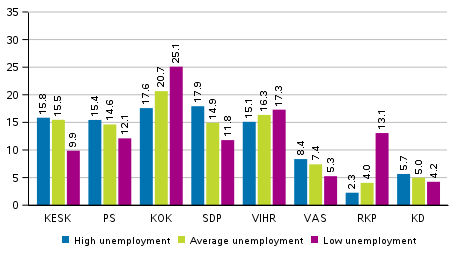
The Centre Party, the Finns Party, the Social Democratic Party, the Left Alliance and the Christian Democrats collected support in areas with average or higher unemployment. Of these, support for the Social Democratic Party focused most clearly on areas with higher unemployment. Measured by the unemployment rate, the support profile for the National Coalition Party, the Green League, and especially the Swedish People's Party, was reversed, the parties’ support was highest in areas of low unemployment.
Support for the parties in the European Parliament elections 2019 by areas specified by the unemployment rate, %
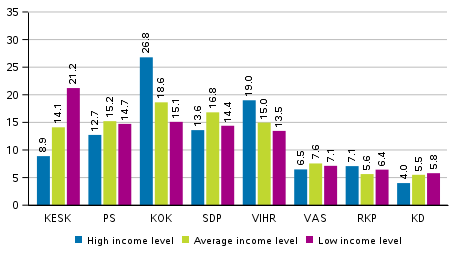
Support for the National Coalition Party and the Green League was highest in areas where the income level was higher than average, while the support for the Centre Party focused on areas with a low income level. Support for the Finns Party, the Left Alliance and especially the Social Democratic Party focused on areas with average income levels, while the support for the Swedish People's Party was lowest in areas with average income levels.
Support for the parties in the European Parliament elections 2019 by areas specified by income level, %
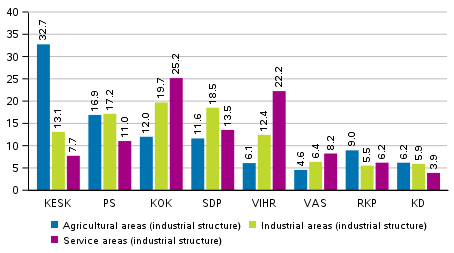
The support profile of the National Coalition Party, the Green League and the Left Alliance was similar measured by the industrial structure of the area. Support for the Green League focused more clearly on service areas.
Support for the Centre Party centred clearly on areas where the economic structure is agriculture-dominated, the party’s support in industrial and service areas was clearly lower. Support for the Social Democratic Party was biggest in industrial areas, their support being lower in agricultural and service areas. Support for the Finns Party was strongest in industrial and agricultural areas.
Support for the parties in the European Parliament elections 2019 by areas specified by industrial structure, %
Source: European Parliament Elections 2014, Statistics Finland
Inquiries: Sami Fredriksson 029 551 2696, Jaana Asikainen 029 551 3506, vaalit@stat.fi
Director in charge: Jari Tarkoma
Publication in pdf-format (453.5 kB)
- Tables
-
Tables in databases
Pick the data you need into tables, view the data as graphs, or download the data for your use.
Appendix tables
- 1. Support for the largest parties in the European Parliament elections in 1996 to 2019 (5.6.2019)
- 2. Finnish Members of the European Parliament elected in the European Parliament elections 2019, votes cast for them, their party, as well as their political group in the European Parliament (5.6.2019)
- Quality descriptions
Updated 5.6.2019
Official Statistics of Finland (OSF):
European Parliament elections [e-publication].
ISSN=1798-291X. 2019. Helsinki: Statistics Finland [referred: 27.7.2026].
Access method: http://stat.fi/til/euvaa/2019/euvaa_2019_2019-06-05_tie_001_en.html