1. Background analysis of candidates and elected MPs in the Parliamentary elections 2011
In the following review persons entitled to vote and background information on the persons nominated as candidates by the parties and on the elected MPs are examined against diverse statistical data. Data on those entitled to vote are based on the voting register established on 2 March 2011. The background information on the persons is based on statistical data from Statistics Finland's Population Statistics, such as statistics on employment and families. Of the persons entitled to vote only those resident in Finland are included in the review.
1.1. Candidates, elected MPs and persons entitled to vote by sex
The total number of candidates nominated in the Parliamentary elections is 2,315. Of these, 1,412 are men and 903 women. Of the parliamentary parties, the True Finns and the Centre Party have in relative terms the lowest proportions of women candidates (33.2% and 41.2%, respectively). Among the major parties, the True Finns are the only parliamentary party where the proportion of women lies below the average (39%). The highest proportions of women candidates are in the Green League (51.8%) and the National Coalition Party (44.8%). Only the Green League has more women than men candidates. The majority, or 51.6 per cent, of the persons entitled to vote are women.
Figure 1. Persons entitled to vote, candidates and elected MPs by sex and party in Parliamentary elections 2011
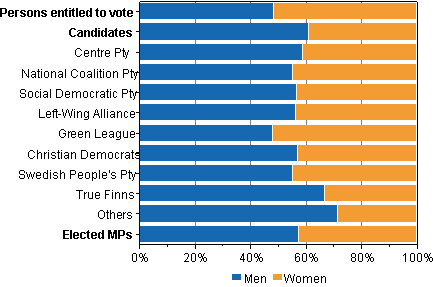
Table 1. Persons entitled to vote, candidates and elected MPs by sex and party in Parliamentary elections 2011
| Men | Women | |
| Persons entitled to vote |
48.4 | 51.6 |
| Candidates | 61.0 | 39.0 |
| Centre Party of Finland KESK |
58.8 | 41.2 |
| National Coalition Party KOK |
55.2 | 44.8 |
| The Finnish Social Democratic Party SDP |
56.7 | 43.3 |
| Left-Wing Alliance LEFT |
56.4 | 43.6 |
| Green League GREENS |
48.2 | 51.8 |
| Christian Democrats in Finland KD |
57.1 | 42.9 |
| Swedish People's Party in Finland RKP |
55.4 | 44.6 |
| True Finns PS |
66.8 | 33.2 |
| Others | 71.5 | 28.5 |
| Elected MPs | 57.5 | 42.5 |
Of the elected MPs, 42.5 per cent are women, which is slightly more than the proportion of women candidates (39%). In relative terms, the proportion of elected female MPs was highest in the Social Democratic Party, where women's proportion of elected MPs is 64.3 per cent. It is over 20 percentage points more than the proportion of women candidates for the party. The Christian Democrats and the Swedish People's Party also received in relative terms more female MPs than they had women as candidates.
Figure 2. Women's proportion of persons entitled to vote, candidates and elected MPs by constituency in Parliamentary elections 2011
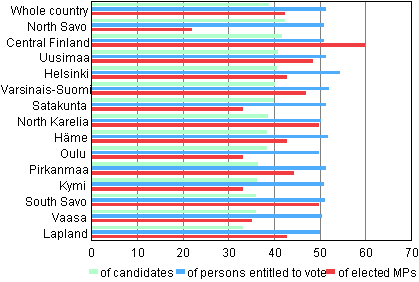
Table 2. Women's proportion of persons entitled to vote, candidates and elected MPs by constituency in Parliamentary elections 2011
| Constituency | Proportion of women of candidates |
Proportion of women of persons entitled to vote |
Proportion of women of elected MPs |
| Whole country | 39.0 | 51.6 | 42.5 |
| North Savo | 42.4 | 51.1 | 22.2 |
| Central Finland | 41.8 | 51.0 | 60.0 |
| Uusimaa | 40.9 | 51.5 | 48.6 |
| Helsinki | 40.8 | 54.5 | 42.9 |
| Varsinais-Suomi | 40.3 | 52.2 | 47.1 |
| Satakunta | 40.2 | 51.4 | 33.3 |
| North Karelia | 38.9 | 50.5 | 50.0 |
| Häme | 38.6 | 51.9 | 42.9 |
| Oulu | 38.5 | 50.0 | 33.3 |
| Pirkanmaa | 36.7 | 51.6 | 44.4 |
| Kymi | 36.4 | 51.0 | 33.3 |
| South Savo | 36.2 | 51.3 | 50.0 |
| Vaasa | 36.1 | 50.7 | 35.3 |
| Lapland | 33.3 | 50.1 | 42.9 |
| Åland | 25.0 | 51.1 | 100.0 |
The lowest proportions of women candidates are in the constituencies of Åland (25.0%) and Lapland (33.3%). The proportions of women candidates are highest in the constituency of North Savo (42.4%). The proportions of women candidates are also higher than the average for the whole country in the constituencies of Central Finland, Uusimaa, Helsinki, Varsinais-Suomi and Satakunta.
The majority of persons entitled to vote are women in all constituencies. The strongest majority is in the constituency of Helsinki, where 54.5 per cent of the persons entitled to vote but only 40.8 per cent of the candidates are women.
The difference between the population structure and the candidate structure, or the under-representation of women, is greatest in the constituency of Åland, where 25 per cent of the candidates, but 51 per cent of the persons entitled to vote, are women. In the constituency of Lapland the proportion of female candidates is 33.3 per cent and 50.1 per cent of persons entitled to vote are women. The difference is smallest in the constituency of North Savo, 8.7 percentage points.
Women make up 42.5 per cent of all elected MPs. More women than men were elected only in the constituency of Central Finland, where 60 per cent of the elected MPs are women. Equal numbers of men and women were elected in North Karelia and South Savo. The lowest proportions of women were elected in North Savo (22.2%) and in the constituencies of Satakunta and Kymi (both 33.3%). It should be noted, however, that in small constituencies randomness may swing the gender proportions quite substantially.
1.2. Foreign background
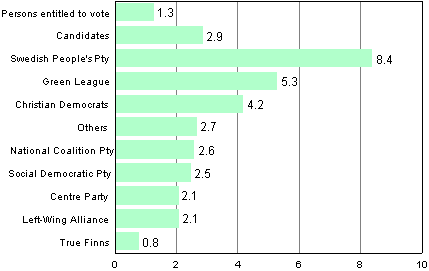
Around three per cent of the candidates have a foreign background. In all, 1.3 per cent of the persons entitled to vote have a foreign background. Persons whose mother tongue is not Finnish, Swedish or Sami are regarded as having a foreign background. The highest proportions of candidates with a foreign background were nominated by the Swedish People's Party (8.4%) and the Green League (5.3%). The True Finns have the lowest proportion of foreign-language speakers as candidates (0.8%).
Figure 3. Persons entitled to vote and candidates with a foreign background in Parliamentary elections 2011
1.3. Average age
The average age of men candidates has fallen by about two years from the previous Parliamentary elections. In contrast, women candidates are now six months older, on average, than in the previous Parliamentary elections. The average age of men candidates is now 46.2 years and that of women candidates 44.3 years. Women candidates are, on average, about two years younger than men candidates are.
Table 3. Average age of candidates by sex and constituency in Parliamentary elections 2011
| Constituency | Men | Women |
| Whole country | 46.2 | 44.3 |
| Lapland | 50.7 | 45.1 |
| North Savo | 47.1 | 46.1 |
| Kymi | 47.1 | 44.7 |
| North Karelia | 47.1 | 42.3 |
| South Savo | 47.0 | 43.5 |
| Pirkanmaa | 46.6 | 45.2 |
| Häme | 46.5 | 44.4 |
| Oulu | 46.3 | 43.0 |
| Satakunta | 46.1 | 43.9 |
| Varsinais-Suomi | 45.9 | 42.6 |
| Uusimaa | 45.8 | 45.3 |
| Åland | 45.2 | 48.5 |
| Helsinki | 44.9 | 43.2 |
| Central Finland | 44.3 | 44.5 |
| Vaasa | 44.2 | 45.2 |
Figure 4. Average age of candidates by sex and constituency in Parliamentary elections 2011
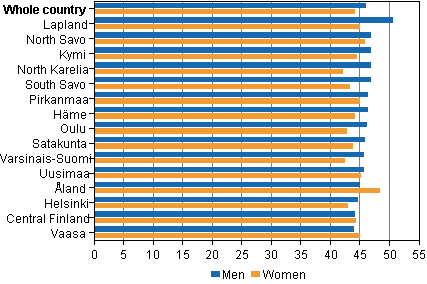
The average age of men entitled to vote is 48.1 years and that of women 50.9 years. Men candidates are a couple of years younger than men entitled to vote, but women candidates are nearly seven years younger than women entitled to vote.
The youngest women candidates were nominated in North Karelia (42.3 years) and Varsinais-Suomi (42.6 years). The youngest men candidates were nominated in the constituencies of Vaasa (44.2 years), Central Finland (44.3 years) and Helsinki (44.9 years). The oldest women candidates were nominated in Åland (48.5 years) and North Savo (46.1 years). Men candidates are oldest in Lapland (50.7 years). The largest age difference between men and women candidates is in Lapland, i.e. 5.6 years and the smallest in Central Finland and Uusimaa, where it is under one year.
The average age of the elected MPs is 48.0 years, that of male MPs 50.2 years and that of female MPs 45.0 years.
Figure 5. Age structure of persons entitled to vote, candidates and elected MPs in Parliamentary elections 2011
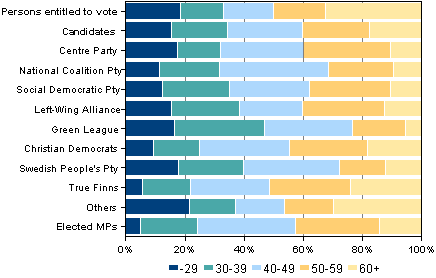
Table 4. Age structure of persons entitled to vote, candidates and elected MPs in Parliamentary elections 2011
| –29 | 30–39 | 40–49 | 50–59 | 60+ | |
| Persons entitled to vote |
18.5 | 14.7 | 16.7 | 17.8 | 32.3 |
| Candidates | 15.5 | 19.1 | 25.3 | 22.7 | 17.4 |
| Centre Party of Finland KESK |
17.6 | 14.6 | 27.9 | 29.6 | 10.3 |
| National Coalition Party KOK |
11.6 | 20.3 | 36.6 | 22.0 | 9.5 |
| The Finnish Social Democratic Party SDP |
12.6 | 22.7 | 26.9 | 27.3 | 10.5 |
| Left-Wing Alliance LEFT |
15.7 | 22.9 | 21.2 | 28.0 | 12.3 |
| Green League GREENS |
16.7 | 30.3 | 29.8 | 18.0 | 5.3 |
| Christian Democrats in Finland KD |
9.4 | 15.7 | 30.4 | 26.2 | 18.3 |
| Swedish People's Party in Finland RKP |
18.1 | 21.7 | 32.5 | 15.7 | 12.0 |
| True Finns PS |
5.9 | 16.0 | 26.9 | 27.3 | 23.9 |
| Others | 21.7 | 15.6 | 16.5 | 16.7 | 29.6 |
| Elected MPs | 5.0 | 19.5 | 33.0 | 28.5 | 14.0 |
The Green League has the highest proportion, nearly one half, of the candidates younger than 40 years of age. The proportion of candidates younger than 40 years of age is higher than their proportion of the persons entitled to vote also in the Swedish People's Party, the Left Alliance and the Social Democratic Party. The lowest proportions of young candidates were nominated by the True Finns and the Christian Democrats. The Coalition Party has the highest proportion of candidates aged 40 to 49.
The True Finns (51.3%) and the Christian Democrats (44.5%) have the highest proportion of candidates aged 50 or over, the True Finns even more than among the persons entitled to vote (50.1%). In the Green League and the Swedish People's Party fewer than 30 per cent of the candidates are over the age of 50.
The proportion of young people among the elected MPs is considerably lower than their proportion of persons entitled to vote or candidates. Only five per cent of the elected MPs are aged under 30, while their proportion of all people entitled to vote is 18.5 per cent and 15.5 per cent of the candidates. Compared with the previous elections, the proportion of young people nevertheless grew by four percentage points. In the 2007 elections only two persons aged under 30 were elected to the Parliament, that is, one per cent. The largest age group in the new Parliament is formed by those aged 40 to 49, to which one third of all MPs belong.
1.4. Employment
At the end of 2009, just over one half, or 53.4 per cent of all persons entitled to vote were employed, 6.7 per cent unemployed, 7.2 per cent students, and 28.8 per cent pensioners. Around 90 per cent of the candidates of the three major parties, the Centre Party, the Coalition Party and the Social Democratic Party, were employed, while in the True Finns the proportion of employed was 66.8 per cent. The Social Democrats, the Coalition Party and the Centre Party have virtually no unemployed candidates. In contrast, 11.3 per cent of the True Finns have been unemployed at the end of 2009. Around 71 per cent of all candidates were employed and about seven per cent were unemployed at the end of 2009.
Figure 6. Persons entitled to vote, candidates and elected MPs by main type of activity in Parliamentary elections 2011
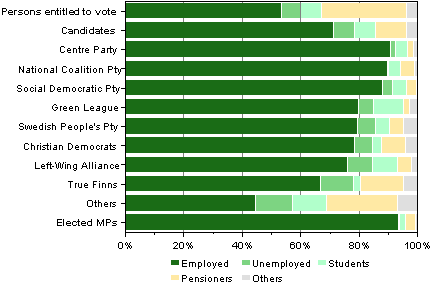
In the major parties only six to nine per cent of the candidates are students or pensioners. The proportion of student candidates is highest in the Green League (10.1%) and the Left Alliance (8.5%). The proportion of pensioner candidates is highest among the True Finns (14.7%) and the Christian Democrats (7.9%).
Table 5. Persons entitled to vote, candidates and elected MPs by main type of activity in Parliamentary elections 2011
| Employed | Unemployed | Students | Pensioners | Others | |
| Persons entitled to vote |
53.4 | 6.7 | 7.2 | 28.8 | 3.8 |
| Candidates | 71.4 | 7.3 | 7.1 | 10.7 | 3.6 |
| Centre Party of Finland KESK |
91.0 | 1.7 | 3.9 | 2.1 | 1.3 |
| National Coalition Party KOK |
89.7 | 0.4 | 4.3 | 4.7 | 0.9 |
| The Finnish Social Democratic Party SDP |
88.2 | 3.4 | 4.6 | 3.4 | 0.4 |
| Green League GREENS |
79.8 | 5.3 | 10.1 | 2.2 | 2.6 |
| Swedish People's Party in Finland RKP |
79.5 | 6.0 | 4.8 | 4.8 | 4.8 |
| Christian Democrats in Finland KD |
78.5 | 6.3 | 3.1 | 7.9 | 4.2 |
| Left-Wing Alliance LEFT |
76.3 | 8.5 | 8.5 | 4.7 | 2.1 |
| True Finns PS |
66.8 | 11.3 | 2.5 | 14.7 | 4.6 |
| Others | 44.8 | 12.4 | 11.8 | 24.2 | 6.8 |
| Elected MPs | 93.5 | 0.5 | 2.0 | 3.5 | 0.5 |
Nearly all elected MPs, or 93.5 per cent, were employed at the end of 2009. In all, 2.0 per cent were students and 3.5 per cent pensioners.
1.5. Family status
Of all persons entitled to vote nearly one quarter are parents of a family with children, or the family had at least one underage child. Nearly three per cent of them are single parents. In addition, around six per cent are parents with only children aged over 18 living at home. Around 33 per cent are childless couples, close on 30 per cent live alone without a family and around eight per cent of persons entitled to vote are young adults living at home.
Figure 7. Persons entitled to vote, candidates and elected MPs by family status in Parliamentary elections 2011
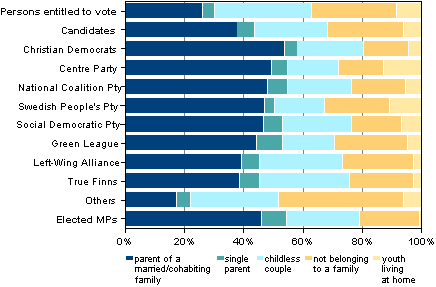
The candidates also differ in their family status from persons entitled to vote: considerably more of them are parents of a family with children and childless couples than is the case among persons entitled to vote. This is of course explained by that the age structure of candidates is younger than among persons entitled to vote. For a major part of those entitled to vote children have already moved from home, while most candidates are at an age when children are still living at home.
The True Finns, the Left Alliance and the Swedish People's Party have the lowest proportion of parents of families with children (37% to 42%), while in other major parties their proportion is 47 to 50 per cent. The proportions of young people living at home are highest among the candidates of the Centre Party (12.9%) and the Swedish People's Party (10.8%). The Green League and the Left Alliance have most candidates without a family, usually living alone, that is, nearly one quarter of all candidates.
Of all persons entitled to vote, 44.3 per cent are married and 14.5 per cent are cohabiting. In all, 48.5 per cent of the candidates are married and 13.9 per cent are cohabiting.
Christian Democrat candidates differ most from the voters in that 74.9 per cent of them are married. The Green League and the Left Alliance have the lowest proportions of married persons (43.0% and 47.9%, respectively) but their proportion of cohabiting couples is highest, about 19 per cent.
Of the elected MPs, 45.5 per cent are parents of a family with children, that is, they have at least one underage child at home. In addition, around nine per cent are parents with adult children living at home. One fifth of the elected MPs do not belong to a family and one quarter are living in a childless partnership.
Table 6. Persons entitled to vote, candidates and elected MPs by family status in Parliamentary elections 2011
| Parent of a married/ cohabiting family |
Single parent |
Childless couple |
Not belonging to a family |
Youth living at home |
|
| Persons entitled to vote |
26.2 | 4.1 | 32.7 | 28.7 | 8.3 |
| Candidates | 37.8 | 5.9 | 24.5 | 25.8 | 5.9 |
| Christian Democrats in Finland KD |
53.9 | 4.2 | 22.5 | 15.2 | 4.2 |
| Centre Party of Finland KESK |
49.4 | 5.6 | 17.2 | 15.0 | 12.9 |
| National Coalition Party KOK |
48.3 | 6.5 | 21.6 | 18.5 | 5.2 |
| Swedish People's Party in Finland RKP |
47.0 | 3.6 | 16.9 | 21.7 | 10.8 |
| The Finnish Social Democratic Party SDP |
46.6 | 6.7 | 23.1 | 16.8 | 6.7 |
| Green League GREENS |
44.3 | 8.8 | 17.5 | 24.6 | 4.8 |
| Left-Wing Alliance LEFT |
39.4 | 5.9 | 28.0 | 24.2 | 2.5 |
| True Finns PS |
38.7 | 6.7 | 30.3 | 21.8 | 2.5 |
| Others | 17.3 | 5.0 | 29.6 | 42.1 | 6.0 |
| Elected MPs | 46.0 | 8.5 | 24.5 | 20.5 | 0.5 |
1.6. Persons entitled to vote, candidates and elected MPs by number of children in 2011
Although the majority of persons entitled to vote and many candidates are not at the moment going through the everyday life of a family with children, it does not mean that they did not have experiences of it. Nearly 35 per cent of persons entitled to vote have never had children of their own, while about 31 per cent of the candidates are completely childless. The proportion of candidates without children is higher than average in parties with a large proportion of young candidates, such as the Green League and the Swedish People's Party. The Christian Democrats have the lowest proportion of candidates without children, only around 20 per cent.
Nearly 80 per cent of the elected MPs have biological children. Large families are also more common to the elected MPs than to persons entitled to vote. Thirty per cent of the elected MPs have at least three children, while this is so for only about one fifth of persons entitled to vote.
Figure 8. Persons entitled to vote, candidates and elected MPs by number of biological children in Parliamentary elections 2011
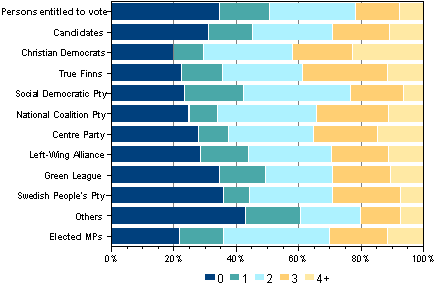
Table 7. Persons entitled to vote, candidates and elected MPs by number of biological children in Parliamentary elections 2011
| 0 | 1 | 2 | 3 | 4+ | |
| Persons entitled to vote |
34.9 | 15.8 | 27.8 | 14.1 | 7.4 |
| Candidates | 31.2 | 14.2 | 25.5 | 18.5 | 10.6 |
| Christian Democrats in Finland KD |
19.9 | 9.9 | 28.3 | 19.4 | 22.5 |
| True Finns PS |
22.7 | 13.0 | 25.6 | 27.3 | 11.3 |
| The Finnish Social Democratic Party SDP |
23.5 | 18.9 | 34.5 | 16.8 | 6.3 |
| National Coalition Party KOK |
25.0 | 9.1 | 31.9 | 22.8 | 11.2 |
| Centre Party of Finland KESK |
27.9 | 9.9 | 27.0 | 20.6 | 14.6 |
| Left-Wing Alliance LEFT |
28.8 | 15.3 | 26.7 | 18.2 | 11.0 |
| Green League GREENS |
34.6 | 14.9 | 21.5 | 18.4 | 10.5 |
| Swedish People's Party in Finland RKP |
36.1 | 8.4 | 26.5 | 21.7 | 7.2 |
| Others | 43.1 | 17.6 | 19.2 | 13.1 | 7.1 |
| Elected MPs | 22.1 | 14.0 | 34.0 | 18.5 | 11.5 |
1.7. Persons entitled to vote, candidates and elected MPs by educational level in 2011
Highly educated people are seeking entry to the Parliament. The educational level of the candidates of almost all parties is higher than that of the average population. Of the total population, 30.8 per cent rely on basic level education, but this is the case only for 11.9 per cent of the candidates. Of the candidates nominated by the major parties even fewer rely on basic level education: around five per cent for the Centre Party, the Social Democratic Party and the Coalition Party, slightly over six per cent for the Green League and the Social Democrats and nearly seven per cent for the Christian Democrats. Around 14 per cent of the True Finns candidates and about ten per cent of the Left Alliance candidates have basic level education only. More than one half of the candidates are educated to the tertiary level, but only about 29 per cent of those entitled to vote have attained that level. The candidates of the National Coalition Party have the highest level of education, as over 74 per cent of them have tertiary level education. The Left Alliance (39.3%) and the True Finns (43.6%) have the lowest proportion of candidates with tertiary level education.
Figure 9. Persons entitled to vote, candidates and elected MPs by educational level in Parliamentary elections 2011
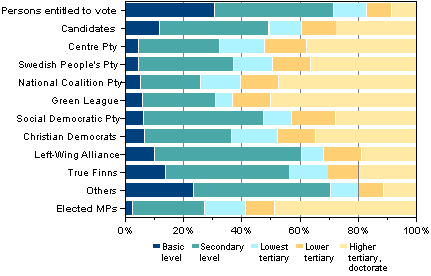
Table 8. Persons entitled to vote, candidates and elected MPs by educational level in Parliamentary elections 2011
| Basic level |
Secondary level |
Lowest tertiary |
Lower tertiary |
Higher tertiary, doctorate |
|
| Persons entitled to vote |
30.8 | 40.7 | 11.3 | 8.8 | 8.4 |
| Candidates | 11.9 | 37.6 | 11.1 | 11.9 | 27.5 |
| Centre Party of Finland KESK |
4.7 | 27.9 | 15.5 | 14.2 | 37.8 |
| Swedish People's Party in Finland RKP |
4.8 | 32.5 | 13.3 | 13.3 | 36.1 |
| National Coalition Party KOK |
5.2 | 20.7 | 13.8 | 12.9 | 47.4 |
| Green League GREENS |
6.1 | 25.0 | 5.7 | 13.2 | 50.0 |
| The Finnish Social Democratic Party SDP |
6.3 | 41.2 | 9.7 | 15.1 | 27.7 |
| Christian Democrats in Finland KD |
6.8 | 29.8 | 15.7 | 13.1 | 34.6 |
| Left-Wing Alliance LEFT |
10.2 | 50.4 | 7.6 | 13.1 | 18.6 |
| True Finns PS |
13.9 | 42.4 | 13.4 | 10.5 | 19.7 |
| Others | 23.6 | 47.0 | 9.6 | 8.5 | 11.3 |
| Elected MPs | 2.5 | 25.0 | 14.0 | 10.0 | 48.5 |
Highly educated people are elected as MPs. Over 70 per cent of the elected MPs have tertiary level education, while this is the case for one half of all candidates and for nearly 30 per cent of all persons entitled to vote. Just 2.5 per cent of MPs rely on basic level education. Of the candidates 11.9 per cent had completed only basic level education and over 30 per cent of all persons entitled to vote.
1.8. Persons entitled to vote, candidates and elected MPs by income subject to state taxation in Parliamentary elections 2011
Income is the one variable that marks the greatest difference between candidates and voters. The median of the candidates' income subject to state taxation is EUR 32,042, that of all persons entitled to vote EUR 21,561 and that of employed persons in 2009 EUR 29,897. Thus, the candidates' income compared with all persons entitled to vote is 1.5 times higher. Compared with working persons entitled to vote, candidates' income is around seven per cent higher. The median income of candidates in 2007 was EUR 30,116, which is 63 per cent higher than the income of persons entitled to vote.
The Coalition Party candidates have the biggest income difference with persons entitled to vote, as their income is around 2.5 times higher than among voters. The income of candidates in the Centre Party, the Social Democrats and the Swedish People's Party is also at least double that of those entitled to vote. Among the parliamentary parties, the Left Alliance and the True Finns are closest to the electorate, but even their income is around 50 per cent higher than among persons entitled to vote. Only for candidates of small parties, the income is below the level of the voters.
Figure 10. Persons to vote, candidates and elected MPs by median income subject to state taxation (in euro) in Parliamentary elections in 2011 and 2007
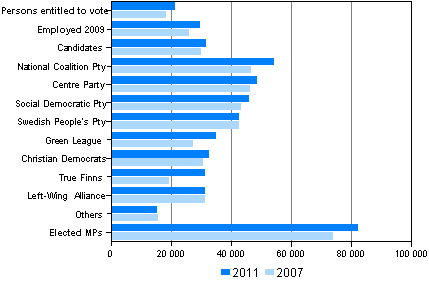
Table 9. Persons to vote, candidates and elected MPs by median income subject to state taxation (in euro) in Parliamentary elections 2011 and 2007
| 2011 | 2007 | |
| Persons entitled to vote |
21,561 | 18,528 |
| Employed | 29,897 | 26,105 |
| Candidates | 32,042 | 30,116 |
| National Coalition Party KOK |
54,569 | 46,895 |
| Centre Party of Finland KESK |
48,722 | 46,561 |
| The Finnish Social Democratic Party SDP |
46,225 | 43,542 |
| Swedish People's Party in Finland RKP |
43,026 | 43,020 |
| Green League GREENS |
35,118 | 27,461 |
| Christian Democrats in Finland KD |
32,850 | 30,757 |
| True Finns PS |
31,645 | 19,518 |
| Left-Wing Alliance LEFT |
31,480 | 31,535 |
| Others | 15,646 | 15,917 |
| Elected MPs | 82,566 | 74,104 |
During the present parliamentary period the nominal income of all persons entitled to vote increased by 16.4 per cent, that of working persons by 14.5 per cent and that of candidates by 6.4 per cent. Income rose most for the candidates of the True Finns, by over 60 per cent, although the median income among them is still the lowest of all parliamentary parties. Among the Greens, the income went up by 27.1 per cent and among the Coalition Party by 16.4 per cent. In other parties, the change in median income is smaller than among all persons entitled to vote. The median income of Left Alliance and small party candidates even decreased from the previous elections.
The median income of the elected MPs was EUR 82,566 per year. Their median income is nearly 3.8 times that of persons entitled to vote and 2.6 times that of the candidates. Compared with the previous Parliamentary elections, the median income of the elected MPs rose by 11.4 per cent.
Figure 11. Median income subject to state taxation (in euro) of persons entitled to vote, candidates and elected MPs by constituency in Parliamentary elections 2011 ¹
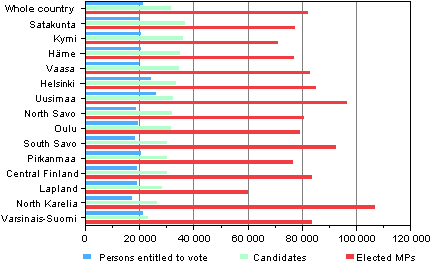
¹ Åland is excluded from the examination due to the small number of observations.
Table 10. Median income subject to state taxation (in euro) of persons entitled to vote, candidates and elected MPs by constituency in Parliamentary elections 2011 1)
| Constituency | Persons entitled to vote |
Candidates | Elected MPs |
| Whole country | 21,561 | 32,042 | 82,566 |
| Satakunta | 19,950 | 36,997 | 77,768 |
| Kymi | 20,669 | 36,167 | 71,459 |
| Häme | 20,958 | 35,166 | 77,197 |
| Vaasa | 20,148 | 34,902 | 83,170 |
| Helsinki | 24,547 | 33,641 | 85,492 |
| Uusimaa | 26,270 | 32,635 | 96,786 |
| North Savo | 19,042 | 32,091 | 80,840 |
| Oulu | 19,858 | 31,694 | 79,421 |
| South Savo | 18,547 | 30,564 | 92,902 |
| Pirkanmaa | 20,892 | 30,504 | 76,333 |
| Central Finland | 19,268 | 30,360 | 83,925 |
| Lapland | 19,127 | 28,542 | 60,174 |
| North Karelia | 17,520 | 26,527 | 107,349 |
| Varsinais-Suomi | 21,524 | 23,215 | 83,775 |
The income level of those entitled to vote is the highest in the constituencies of Uusimaa and Helsinki. The candidates with the highest income come from Satakunta, Kymi and Häme. The income of the candidates and persons entitled to vote is closest to each other in the constituency of Varsinais-Suomi, where the candidates' median income was only EUR 1,700 higher than that of persons entitled to vote. The difference is biggest in Satakunta, where it is around EUR 17,000. Except for Varsinais-Suomi, Helsinki, Uusimaa, Pirkanmaa and Lapland the candidates' median income is at least 50 per cent higher than in the electorate of the area. Voters have the lowest income in North Karelia and South Savo, where the voters' median income remained under EUR 19,000. The candidates with the lowest income, EUR 23,000, come from the constituency of Varsinais-Suomi.
MPs with the highest income were elected from the constituency of North Karelia. There the median income of the elected MPs is EUR 107,349, which is over six times that of persons entitled to vote and four times that of the candidates in that area. MPs with the lowest income were elected in the constituency of Lapland, where the median income of the elected MPs was slightly over EUR 60,000.
1.9. Income brackets
In the following, comparisons are made on the division of candidates into income quintiles that are formed on the basis of the income subject to state taxation of persons entitled to vote. In the division into income quintiles the income brackets are determined so that there is an equal number of persons in each quintile, i.e. 20 per cent of the persons entitled to vote. For the sake of comparison, employed persons in 2009 are also examined in the same income brackets.
The lowest quintile among persons entitled to vote earned in 2009 under EUR 9,708 and the highest quintile over EUR 36,333. Seven per cent of employed persons and 16 per cent of the candidates belong to the lowest quintile. Correspondingly, one third of employed persons and nearly 43 per cent of the candidates belong to the highest income quintile. Of the Coalition Party candidates 75 per cent and nearly two thirds of the Centre Party and SDP candidates belong to the highest income bracket. The proportion of low-income candidates in the parliamentary parties is highest for the Swedish People's Party, the Green League and the Left Alliance. Their low-income earning is explained by the candidates' younger than average age structure and larger student background than among others.
The income structure of small parties’ candidates resembles the average income structure of voters more closely than that of the major parties’ candidates. As many as nearly one third of the candidates of small parties belong to the lowest income bracket and only 14 per cent to the highest income bracket.
Nearly 90 per cent of the elected MPs belong to the highest income quintile. In all, 42.6 per cent of the candidates and 32.6 per cent of employed persons in 2009 belonged to this group. Only 2.5 per cent of the elected MPs were in the lowest quintile, that is, earned less than EUR 9,708.
Figure 12. Persons entitled to vote, candidates and elected MPs by income subject to state taxation (in euro) in Parliamentary elections 2011
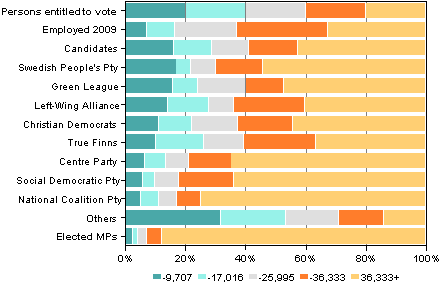
Table 11. Persons entitled to vote, candidates and elected MPs by income subject to state taxation (in euro) in Parliamentary elections 2011
| -9,707 | -17,016 | -25,995 | -36,333 | 36,333+ | |
| Persons entitled to vote |
20.0 | 20.0 | 20.0 | 20.0 | 20.0 |
| Employed 2009 |
7.0 | 9.5 | 20.6 | 30.3 | 32.6 |
| Candidates | 16.0 | 12.6 | 12.4 | 16.4 | 42.6 |
| Swedish People's Party in Finland RKP |
16.9 | 4.8 | 8.4 | 15.7 | 54.2 |
| Green League GREENS |
15.8 | 8.3 | 15.8 | 12.7 | 47.4 |
| Left-Wing Alliance LEFT |
14.0 | 13.6 | 8.5 | 23.7 | 40.3 |
| Christian Democrats in Finland KD |
11.0 | 11.0 | 15.2 | 18.3 | 44.5 |
| True Finns PS |
10.1 | 16.0 | 13.4 | 23.9 | 36.6 |
| Centre Party of Finland KESK |
6.4 | 6.9 | 7.7 | 14.2 | 64.8 |
| The Finnish Social Democratic Party SDP |
5.9 | 3.8 | 8.0 | 18.5 | 63.9 |
| National Coalition Party KOK |
5.2 | 6.0 | 6.0 | 7.8 | 75.0 |
| Others | 31.6 | 21.9 | 17.5 | 14.9 | 14.2 |
| Elected MPs | 2.5 | 1.5 | 2.5 | 5.0 | 88.5 |
Source: Parliamentary Elections 2011, confirmed result. Statistics Finland
Inquiries: Kimmo Moisio (09) 1734 3239, Jaana Asikainen (09) 1734 3506, vaalit@stat.fi
Director in charge: Jari Tarkoma
Updated 29.4.2011
Official Statistics of Finland (OSF):
Parliamentary elections [e-publication].
ISSN=1799-6279. 2011,
1. Background analysis of candidates and elected MPs in the Parliamentary elections 2011
. Helsinki: Statistics Finland [referred: 21.2.2026].
Access method: http://stat.fi/til/evaa/2011/evaa_2011_2011-04-29_kat_001_en.html

