1. Background analysis of candidates and elected MPs in the Parliamentary elections 2015
In the following, persons entitled to vote, candidates nominated by the parties and the elected MPs are examined according to various background information. The data on persons entitled to vote derive from the voting register established on 4 March 2015 and the data on the candidates from the candidate register set up on 19 March 2015. The data on the elected MPs are based on the result confirmed on 22 April 2015. The background data are based on Statistics Finland’s statistical data, such as population, employment and family statistics and the Register of Completed Education and Degrees. Of the persons entitled to vote only those resident in Finland are included in the review. The parties that got candidates elected into parliament in the 2011 Parliament elections are presented in the Figures and Tables, and in the analysis they are called "Parliamentary parties". The data on the candidates of other parties and constituency associations are summed under the group "Others".
The candidates and elected MPs differ by age structure and sex from all persons entitled to vote. This should be taken into consideration when comparing the candidates with persons entitled to vote. In the tables and figures of this analysis, the data are not age-standardised. Standardisation would slightly lower the difference between the candidates and those entitled to vote for example when comparing the level of education, main type of activity, family status and socio-economic group among the candidates and persons entitled to vote.
1.1. Candidates, elected MPs and persons entitled to vote by sex
Women’s share of the candidates and elected MPs has stabilised at 40 per cent
The total number of candidates nominated in the Parliamentary elections is 2,146, which is 169 fewer candidates than in the previous election but still 142 more than in the 2007 Parliamentary elections. In the 2011 elections, nearly all parliamentary parties nominated more candidates than in 2007. Now, only the Swedish People's Party in Finland (RKP) and Christian Democrats in Finland nominated more candidates than in the previous elections. The Swedish People's Party in Finland increased their number of candidates by 25 per cent from 83 to 104. (Table 1)
Table 1. Number of candidates by party in Parliamentary elections 2007, 2011 and 2015
| Party | Number of candidates by party |
Change from the previous elections,, (%) |
|||
| 2007 | 2011 | 2015 | 2011 | 2015 | |
| Candidates total |
2,004 | 2,315 | 2,146 | 15.5 | -7.3 |
| National Coalition Party KOK |
225 | 232 | 214 | 3.1 | -7.8 |
| Finnish Social Democratic Party SDP |
230 | 238 | 216 | 3.5 | -9.2 |
| Finns Party PS |
168 | 238 | 215 | 41.7 | -9.7 |
| Centre Party of Finland KESK |
233 | 233 | 216 | 0.0 | -7.3 |
| Left Alliance VAS |
208 | 236 | 216 | 13.5 | -8.5 |
| Green League VIHR |
202 | 228 | 208 | 12.9 | -8.8 |
| Swedish
People’s Party in Finland RKP |
75 | 83 | 104 | 10.7 | 25.3 |
| Christian Democrats in Finland KD |
188 | 191 | 193 | 1.6 | 1.0 |
| Others | 475 | 636 | 564 | 33.9 | -11.3 |
Of the candidates, 1,301 were men and 845 were women. In relative terms, the Finns Party (35.3%) and Centre Party of Finland (39.8%) nominated least female candidates of the parliamentary parties in the 2015 elections. Among the major parties, the Finns Party was the only party where the proportion of women lied below the average (39.4%). The Green League (56.3%) and the Finnish Social Democratic Party (47.2%) had most female candidates. Only the Green League had more female than male candidates. A majority, or 51.5 per cent, of the persons entitled to vote are women. (Figure 1, Table 2)
Figure 1. Persons entitled to vote, candidates (by party) and elected MPs by sex in Parliamentary elections 2015, %
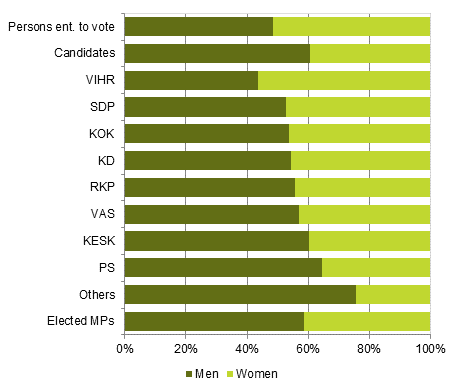
Women's proportion of the candidates has remained on the same level throughout the 2000s, i.e. marginally under 40 per cent. The Finns Party has increased its proportion of women candidates since 2003 by ten percentage points. Despite this, the proportion of women candidates among the Finns Party's candidates was the lowest among the parliamentary parties. In addition to the Finns Party, the National Coalition Party, the Green League and the Christian Democrats in Finland increased their proportion of women of all candidates compared with the previous elections.
In all, 117 men and 83 women were elected as MPs. Women's proportion of the elected MPs is 41.5 per cent, which is a few percentage points higher than women's proportion of the candidates. Women's proportion of the elected MPs rose in the 2007 elections to over 40 per cent and has stabilised to that level ever since. However, compared to the 2011 elections, one percentage point fewer women were elected to Parliament.
In relative terms, most women were elected from the Christian Democrats, the Social Democrats and the Left Alliance. In all of them, over one-half of the elected MPs are women. Women's shares of elected MPs were smallest in the Centre Party (28.6%), the Finns Party (31.6%) and the Swedish People's Party (33.3%).
The Left Alliance and the SDP have become women's parties. In the 2003 elections, 26 per cent of the Left Alliance's elected MPs were women and in the 2007 elections just 17 per cent. A clear jump occurred in the 2011 elections, when women's proportion of the party's elected MPs was already over 40 per cent and now in 2015 nearly 60 per cent. A similar trend has also been visible for those elected from the SDP. However, the trend has been opposite for the Green League. While in the 2003 elections nearly 80 per cent of the Green League MPs were women, now women's proportion has dropped to under 50 per cent. In small parties, such as the Swedish People's Party and the Christian Democrats, randomness may swing the gender proportions quite substantially.
Table 2. Women's proportion of persons entitled to vote, candidates and elected MPs (by party) in Parliamentary elections 2003, 2007, 2011 and 2015, %
| Party | 2003 | 2007 | 2011 | 2015 |
| Persons entitled to vote |
51.7 | 51.6 | 51.6 | 51.5 |
| Candidates | 39.8 | 39.9 | 39.0 | 39.4 |
| National Coalition Party KOK |
49.1 | 44.0 | 44.8 | 46.3 |
| Finnish Social Democratic Party SDP |
48.0 | 49.1 | 43.3 | 47.2 |
| Finns Party PS |
24.6 | 25.0 | 33.2 | 35.3 |
| Centre Party of Finland KESK |
41.5 | 43.8 | 41.2 | 39.8 |
| Left Alliance VAS |
44.6 | 45.7 | 43.6 | 43.1 |
| Green League VIHR |
52.2 | 52.5 | 51.8 | 56.3 |
| Swedish
People’s Party in Finland RKP |
41.6 | 45.3 | 44.6 | 44.2 |
| Christian Democrats in Finland KD |
40.9 | 39.4 | 42.9 | 45.6 |
| Others | 28.1 | 28.2 | 28.5 | 24.5 |
| Elected MPs | 37.5 | 42.0 | 42.5 | 41.5 |
| National Coalition Party KOK |
37.5 | 40.0 | 34.1 | 43.2 |
| Finnish Social Democratic Party SDP |
45.3 | 55.6 | 64.3 | 61.8 |
| Finns Party PS |
0.0 | 20.0 | 28.2 | 31.6 |
| Centre Party of Finland KESK |
23.6 | 29.4 | 34.3 | 28.6 |
| Left Alliance VAS |
26.3 | 17.6 | 42.9 | 58.3 |
| Green League VIHR |
78.6 | 66.7 | 50.0 | 46.7 |
| Swedish
People’s Party in Finland RKP |
50.0 | 55.6 | 55.6 | 33.3 |
| Christian Democrats in Finland KD |
42.9 | 57.1 | 50.0 | 60.0 |
Least women candidates in the constituencies of Vaasa and Lapland
In the 2015 elections, least women candidates were found in the constituencies of Vaasa and Lapland, i.e. around 36 per cent. The proportion of women candidates was at the same level also in the 2007 and 2011 elections. In the constituency of Lapland, the proportion of women candidates grew compared to the 2011 elections with a couple of percentage points, but it was still three percentage points lower than in the 2007 elections. (Figure 2, Table 3)
Of the constituencies in Mainland Finland, the constituency of Häme had most women candidates (42.5%). Also in the constituencies of Helsinki, Varsinais-Suomi, Central Finland and Oulu the proportion of women was over 40 per cent. Of the seven candidates in the constituency of Åland, four were women, i.e. 57 per cent.
In nearly all constituencies, the majority of persons entitled to vote are women. The majority is strongest in the constituency of Helsinki, where 54.3 per cent of the persons entitled to vote are women. In the constituencies of Oulu and Lapland, there are nearly as many women as men entitled to vote.
The under-representation of women among candidates was largest in the constituencies of Vaasa, Lapland and Pirkanmaa, where there were 14 percentage points fewer women candidates than their proportion of persons entitled to vote. This difference was smallest in the constituencies of Häme, Central Finland and Oulu, i.e. under ten percentage points.
In relative terms, most women elected to Parliament from the constituencies of Lapland and Varsinais-Suomi
More women than men were elected in the constituencies of Lapland and Varsinais-Suomi. In the constituencies of Satakunta, Savo-Karelia and Oulu, an equal number of women and men were elected. In relative terms, the lowest number of women were elected from the constituencies of Central Finland and Vaasa, where women's share of elected MPs was only around 30 per cent. It should be noted, however, that in small constituencies randomness may swing the gender proportions quite substantially.
Figure 2. Women’s proportion of persons entitled to vote, candidates and elected MPs by constituency in Parliamentary elections 2015, %
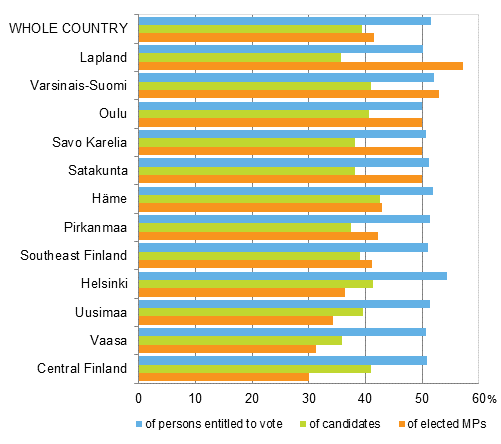
Åland constituency excluded from the figure due to the low number of candidates
Table 3. Women’s proportion of candidates and elected MPs by constituency in Parliamentary elections 2007, 2011 and 2015, % 1)
| Constituency | Women’s proportion of candidates, % | Women’s proportion of elected MPs (%) | ||||
| 2007 | 2011 | 2015 | 2007 | 2011 | 2015 | |
| Whole country | 39.9 | 39.0 | 39.4 | 42.0 | 42.5 | 41.5 |
| Helsinki | 40.8 | 40.8 | 41.3 | 61.9 | 42.9 | 36.4 |
| Uusimaa | 42.6 | 40.9 | 39.6 | 50.0 | 48.6 | 34.3 |
| Varsinais-Suomi | 39.6 | 40.3 | 41.0 | 41.2 | 47.1 | 52.9 |
| Satakunta | 37.4 | 40.2 | 38.1 | 22.2 | 33.3 | 50.0 |
| Häme | 39.0 | 38.6 | 42.5 | 42.9 | 42.9 | 42.9 |
| Pirkanmaa | 44.1 | 36.7 | 37.4 | 27.8 | 44.4 | 42.1 |
| Southeast Finland | 37.1 | 36.3 | 38.9 | 44.4 | 38.9 | 41.2 |
| Savo-Karelia | 41.0 | 40.7 | 38.1 | 25.0 | 33.3 | 50.0 |
| Vaasa | 36.1 | 36.1 | 35.9 | 41.2 | 35.3 | 31.3 |
| Central Finland | 37.9 | 41.8 | 40.9 | 50.0 | 60.0 | 30.0 |
| Oulu | 37.2 | 38.5 | 40.6 | 38.9 | 33.3 | 50.0 |
| Lapland | 38.6 | 33.3 | 35.6 | 28.6 | 42.9 | 57.1 |
One third of the candidates also ran in 2011
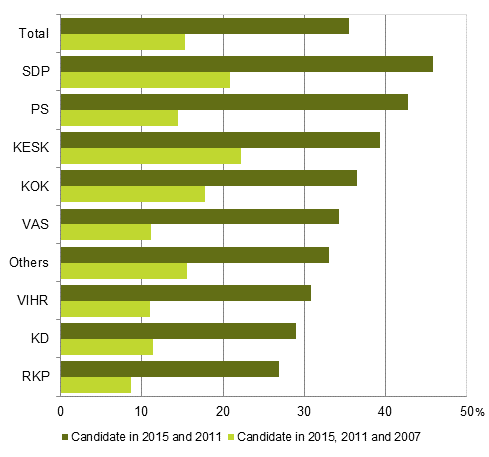
Of the candidates in the Parliamentary elections 2015, good one-third also ran in the 2011 elections and around 15 per cent had been candidates both in the 2011 and 2007 elections. Among the parliamentary parties, the Finnish Social Democratic Party (45.8%) and the Finns Party (42.8%) had most of the same candidates in the elections compared to the previous elections. The Swedish People's Party (26.9%) and the Christian Democrats in Finland (29.0%) had least of the same candidates. The Swedish People's Party in Finland and the Christian Democrats in Finland are the only parties that increased their number of candidates from the previous elections, the Swedish People's Party in Finland by as much as one-quarter. (Figure 3)
Figure 3. Proportion of the same candidates (by party) in the Parliamentary elections 2007, 2011 and 2015, % of the party’s candidates
One-third of those elected as MPs were also elected in two previous elections
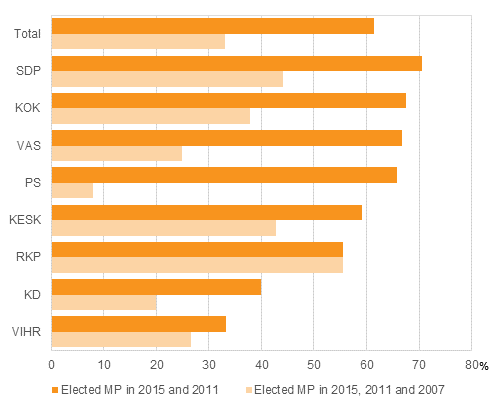
Of the elected MPs, 61.5 per cent had been elected in the previous elections in 2011 as well. In relative terms, the biggest loser of the elections, the SDP had most of the same elected MPs (70.6%). In relative terms, the lowest number of the same MPs were elected from the Green League, which was one of the winners in the elections. One-third of the new MPs were elected in the two previous elections as well. (Figure 4).
Figure 4. Proportion of the same elected MPs (by party) in the Parliamentary elections 2007, 2011 and 2015, % of the party’s elected MPs
1.2. Age structure
Candidates were, on average, 4.5 years younger than persons entitled to vote
The average age of male candidates was 46.1 years and that of female candidates 45.2 years. On average, female candidates were around six years younger than persons entitled to vote and men candidates close on three years younger. The average age of persons entitled to vote has risen by close on one year since the previous Parliamentary elections On the day of the election, the average age of persons entitled to vote was now 48.9 for men and 51.5 for women.
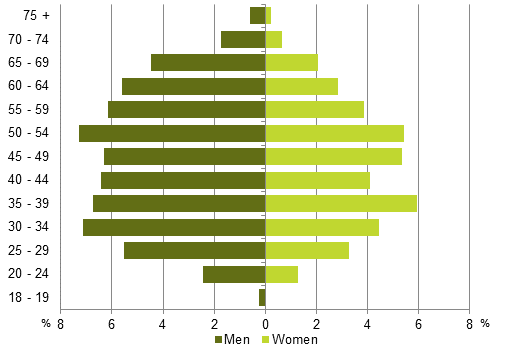
The age structure of the candidates is very different from that of persons entitled to vote (Figures 5 and 6). The age pyramid of neither group is no longer a pyramid as the name indicates. The pyramid of persons entitled to vote, is uniform up to those aged 70, after which the age groups shrink considerably. The pyramid of the candidates shows the majority of men in all age groups and the fact that the youngest and oldest age groups are missing. There are most male candidates aged 30 to 34 and 50 to 54. For female candidates, the focus is on the age groups 35 to 39 and 45 to 54.
Figure 5. Age distributions of persons entitled to vote by sex in Parliamentary elections 2015, % of all persons entitled to vote
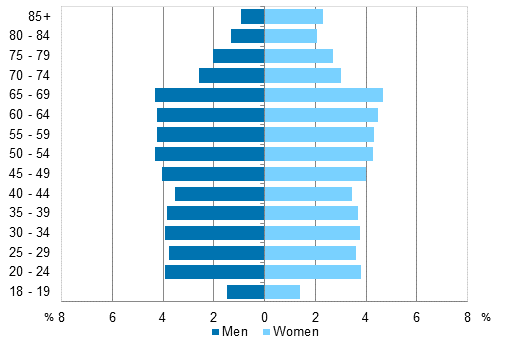
Figure 6. Age distributions of candidates by sex in Parliamentary elections 2015, % of all candidates
Women in majority of MPs aged under 50
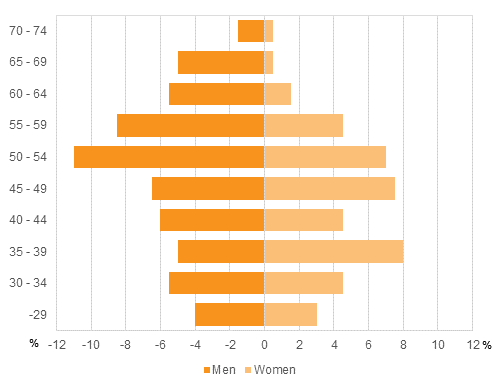
The elected men are clearly older than the women elected to Parliament. The average age of the elected male MPs is 49.1 years and that of female MPs 44.4 years. Most men are in the 50 to 54 age group (11.0 per cent of all elected MPs) and most women in the 35 to 39 age group (8 per cent of all elected MPs). Only 17.2 per cent of those at the top end of the age range, aged 60 or over, are women. Those aged under 50 have a slim female majority: 50.5 per cent of those aged under 50 are women.
Now, considerably more aged under 35 were elected as MPs than in the previous elections. Seventeen per cent of the elected MPs are aged under 35, while in the two previous elections, the share of young people has been 12 to 13 per cent.
Elected MPs from the Christian Democrat Party and the Centre Party are older than the average. The average age of elected male MPs from the Christian Democrat Party is 52.6 years and that of MPs from the Centre Party 51.0 years. (Table 4, Figures 6 and 7)
Figure 7. Age distributions of elected MPs by sex in Parliamentary elections 2015, % of all elected MPs
The Christian Democrats in Finland had the oldest candidates
Of the parliamentary parties, the Christian Democrats in Finland had the oldest candidates: the average age of their candidates was 49.7 years and there were 12.2 per cent of candidates aged 65 or over. In turn, the Green League candidates were the youngest. Around one-third of the Green League candidates were aged under 35, and the average age of the candidates was 40.6 years. Around one-quarter of the candidates of all parties were aged under 35 and around ten per cent were aged 65 or over. (Figure 8, Table 4)
Figure 8. Persons entitled to vote, candidates (by party) and elected MPs by age group in Parliamentary elections 2015, %
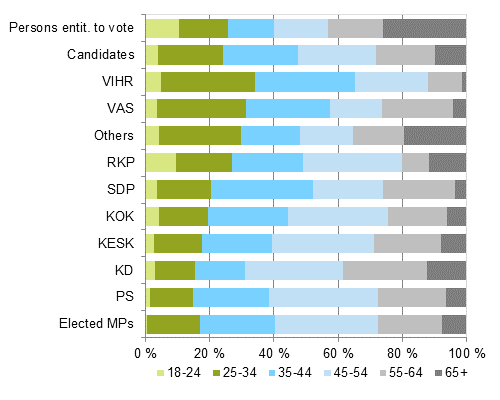
Table 4. Average age of persons entitled to vote, candidates and elected MPs (by party) by sex in Parliamentary elections 2015
| Party | Total | Men | Women |
| Persons entitled to vote |
50.3 | 48.9 | 51.5 |
| Candidates | 45.8 | 46.1 | 45.2 |
| National Coalition Party KOK |
45.5 | 46.5 | 44.3 |
| Finnish Social Democratic Party SDP |
44.6 | 45.6 | 43.5 |
| Finns Party PS |
47.3 | 48.6 | 44.9 |
| Centre Party of Finland KESK |
47.1 | 48.1 | 45.5 |
| Left Alliance VAS |
43.3 | 43.6 | 42.8 |
| Green League VIHR |
40.6 | 40.8 | 40.4 |
| Swedish
People’s Party in Finland RKP |
44.5 | 45.4 | 43.3 |
| Christian Democrats in Finland KD |
49.7 | 50.4 | 48.9 |
| Others | 47.0 | 45.7 | 51.0 |
| Elected MPs | 47.2 | 49.1 | 44.4 |
| National Coalition Party KOK |
47.1 | 51.3 | 41.4 |
| Finnish Social Democratic Party SDP |
46.6 | 50.5 | 44.2 |
| Finns Party PS |
46.2 | 45.3 | 48.3 |
| Centre Party of Finland KESK |
51.0 | 53.3 | 45.4 |
| Left Alliance VAS |
43.7 | 52.6 | 37.3 |
| Green League VIHR |
41.7 | 38.6 | 45.1 |
| Swedish
People’s Party in Finland RKP |
45.4 | 43.2 | .. |
| Christian Democrats in Finland KD |
52.6 | .. | .. |
| Others | .. | .. | .. |
1.3. Foreign background
The Swedish People’s Party in Finland had most foreign-language speaking candidates
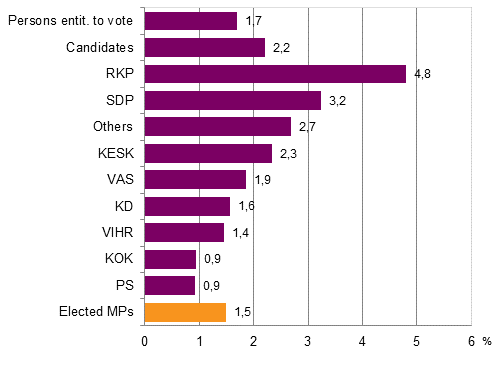
The proportion of foreign-language speaking candidates was slightly higher than that of persons entitled to vote. Of the candidates, 2.2 per cent were foreign-language speakers, while of the persons entitled to vote, 1.7 per cent speak a foreign language as their native language (Table 5). The proportion of foreign-language speaking candidates decreased somewhat from the 2011 Parliamentary elections, even though the share of foreign-language speakers entitled to vote increased. More than one-half of foreign-language speaking candidates run in the constituencies of Helsinki or Uusimaa.
There were also slightly more Swedish speaking candidates than persons entitled to vote. Of the persons entitled to vote, 5.3 per cent speak Swedish as their native language, while 6.6 per cent of candidates do. In Mainland Finland, the Swedish speaking candidates focused on the constituencies of Vaasa, Uusimaa and Helsinki.
The Swedish People's Party in Finland, nearly five per cent, and the Finnish Social Democratic Party, 3.2 per cent had most foreign-language speaking candidates (Figure 9). The Finns Party and the National Coalition Party, in turn, had least foreign-language speaking candidates.
Of the elected MPs, 1.5 per cent are foreign-language speakers and 8.0 Swedish speakers. The share of foreign-language speakers is slightly lower than their share among persons entitled to vote. The share of Swedish speakers among elected MPs is slightly bigger than their share of the population.
Table 5. Persons entitled to vote, candidates and elected MPs by sex and language in Parliamentary elections 2015, %
| Total | Men | Women | |
| Persons entitled to vote | 100.0 | 100.0 | 100.0 |
| Finnish, sami | 92.9 | 92.9 | 92.9 |
| Swedish | 5.3 | 5.5 | 5.2 |
| Other language | 1.7 | 1.6 | 1.9 |
| Candidates | 100.0 | 100.0 | 100.0 |
| Finnish, sami | 91.3 | 91.4 | 91.1 |
| Swedish | 6.6 | 6.4 | 6.9 |
| Other language | 2.2 | 2.2 | 2.0 |
| Elected MPs | 100.0 | 100.0 | 100.0 |
| Finnish, sami | 90.5 | 90.6 | 90.4 |
| Swedish | 8.0 | 8.5 | 7.2 |
| Other language | 1.5 | 0.9 | 2.4 |
Figure 9. Foreign-language speakers’ proportion of persons entitled to vote, candidates (by party) and elected MPs in Parliamentary elections 2015, %
In all, 2.5 per cent of candidates were of foreign origin
The foreign background of the population can also be examined by the person's origin. Persons, whose both parents (or only parent) have been born abroad are defined as persons of foreign origin. In the Parliamentary elections 2015, altogether 2.5 per cent of candidates and close on two per cent of persons entitled to vote were of foreign origin. The proportion of persons of foreign origin grew somewhat both among candidates and persons entitled to vote. The proportion of persons of foreign origin among everyone living in Finland is, however, higher, as only Finnish citizens are entitled to vote and eligible to stand as candidates in the Parliamentary elections. In 2007, altogether 3.5 per cent of the population living in Finland were of foreign origin and at the end of 2014 the share was 5.5 per cent. (Figure 10)
Figure 10. The proportion of persons of foreign origin among persons entitled to vote and candidates in Parliamentary elections 2007, 2011 and 2015, %
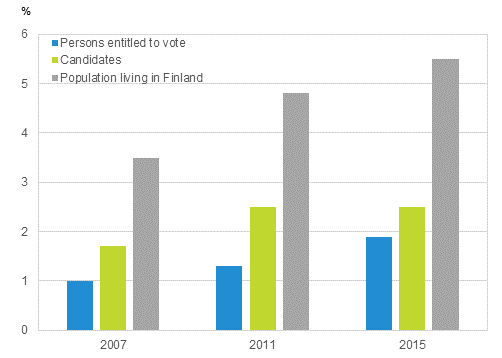
Latest data concerning the population living in Finland are from at the end of 2014
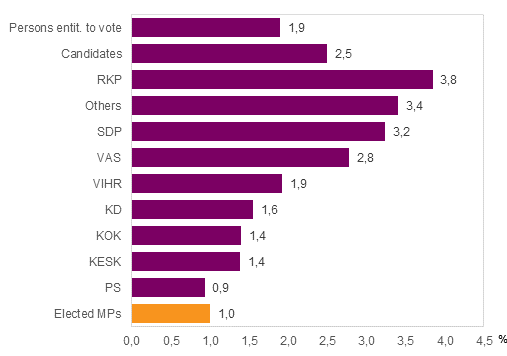
Of the parliamentary parties, the Swedish People's Party in Finland (3.8%), the Finnish Social Democratic Party (3.2%), and the Left Alliance (2.8%) had most candidates of foreign origin. Of the parties outside the parliament, around six per cent of the candidates of the Communist Party of Finland and good three per cent of the candidates of the Independence Party were of foreign origin. Of the parliamentary parties, the Finns Party had least candidates of foreign origin, close on one per cent. (Figure 11)
One per cent of the elected MPs are of foreign origin.
Figure 11. Proportion of persons entitled to vote, candidates (by party) and elected MPs of foreign origin in Parliamentary elections 2015, %
1.4. Educational level
More and more highly educated people sought entry to the Parliament
Highly educated people sought entry to the Parliament. Already nearly one-half of the candidates had tertiary level qualifications, while only around 20 per cent of persons entitled to vote do. Of all candidates, only 9.1 per cent had only basic level education, but among persons entitled to vote, the share of those with only basic level education is 27.2 per cent. (Figure 12, Table 6)
The education level of candidates has risen from one election to another. In the 2007 elections, around 14 per cent of candidates had only basic level education and in the 2015 elections close on ten per cent. Correspondingly, the share of candidates with tertiary level qualifications has increased from the 2007 elections by around ten percentage points, from 39.4 to 48.7 per cent.
The candidates of the National Coalition Party had the highest level of education, 55 per cent of them had higher university or doctorate level degrees. The Left Alliance (22.2%) and the Finns Party (23.7%) had the lowest proportion of candidates with this level of education.
Seventy per cent of elected MPs have tertiary level qualifications
Highly educated people are elected as MPs. Nearly 70 per cent of the elected MPs have tertiary level education, while this is the case for around one half of all candidates and for about 20 per cent of all persons entitled to vote. Just 3.5 per cent of the MPs rely on basic level education. Of the candidates 9.1 per cent had completed only basic level education and around 27.2 per cent of all persons entitled to vote.
Women are nowadays more educated than men, particularly in the youngest age groups. This is also the case in the new Parliament. Around 76 per cent of female MPs have completed tertiary level qualifications and this is so for 63 per cent of male MPs.
Figure 12. Persons entitled to vote, candidates (by party) and elected MPs by level of education in Parliamentary elections 2015, %
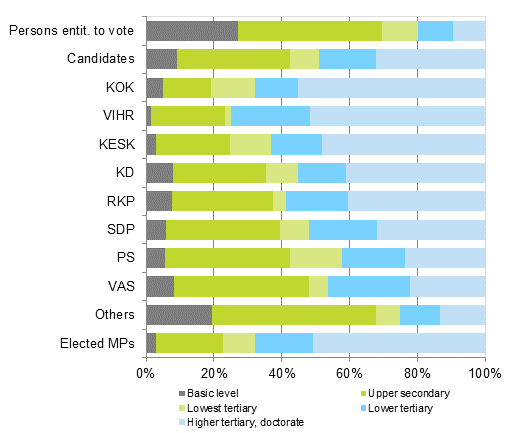
Table 6. Persons entitled to vote and candidates (by party) and elected MPs by educational level in Parliamentary elections 2015, %
| Party | Total | Basic level |
Upper secondary level |
Lowest level tertiary |
Lower-degree level tertiary |
Higher-degree level tertiary doctorate |
| Persons entitled to vote |
100.0 | 27.2 | 42.2 | 10.7 | 10.3 | 9.6 |
| Candidates | 100.0 | 9.1 | 33.3 | 8.6 | 16.6 | 32.4 |
| National Coalition Party KOK |
100.0 | 5.1 | 14.0 | 13.1 | 12.6 | 55.1 |
| Green League VIHR |
100.0 | 1.4 | 21.7 | 1.9 | 23.2 | 51.7 |
| Centre Party of Finland KESK |
100.0 | 2.8 | 22.0 | 12.1 | 15.0 | 48.1 |
| Christian Democrats in Finland KD |
100.0 | 7.8 | 27.6 | 9.4 | 14.1 | 41.1 |
| Swedish People's Party in Finland RKP |
100.0 | 7.7 | 29.8 | 3.8 | 18.3 | 40.4 |
| Finnish Social Democratic Party SDP |
100.0 | 6.0 | 33.3 | 8.8 | 19.9 | 31.9 |
| Finns Party PS |
100.0 | 5.6 | 36.7 | 15.3 | 18.6 | 23.7 |
| Left Alliance VAS |
100.0 | 8.3 | 39.8 | 5.6 | 24.1 | 22.2 |
| Others | 100.0 | 19.5 | 48.2 | 7.2 | 11.8 | 13.3 |
| Elected MPs | 100.0 | 3.0 | 19.6 | 9.5 | 17.1 | 50.8 |
| Men | 100.0 | 5.2 | 22.4 | 10.3 | 18.1 | 44.0 |
| Women | 100.0 | 0.0 | 15.7 | 8.4 | 15.7 | 60.2 |
1.5. Labour market position
A majority of candidates and elected MPs are in working life
The biggest difference in the main activity of candidates and persons entitled to vote is found in the share of employed persons and pensioners. The latest statistical data are from the end of 2013. At that time, a little over one-half of all persons entitled to vote were employed, while over 70 per cent of the candidates were employed. There are, in turn, clearly more pensioners among persons entitled to vote than among candidates, i.e. around 30 per cent. Around one in ten of the candidates were pensioners. The difference is mainly caused by the age structure. Of the candidates, fewer than ten per cent were aged 65 or over, while 26 per cent of the persons entitled to vote have turned 65. If the candidates are compared with the persons entitled to vote aged under 65, the difference between the candidates and persons entitled to vote decreases.
Nearly 90 per cent of the Centre Party of Finland and the Finnish Social Democratic Party were employed. Over 80 per cent of the candidates of the National Coalition Party, the Green League and the Finns Party were also employed. Among the parliamentary parties, the lowest share of employed persons was found in the Left Alliance (73.1%). The share of pensioners was exceptionally high among candidates outside the parliamentary parties. Among the parliamentary parties, the Christian Democrats in Finland and the Swedish People's Party in Finland had most pensioner candidates. (Figure 13, Table 7)
There was roughly the same proportion of students and unemployed persons among persons entitled to vote and candidates. The Left Alliance and the Green League had most student candidates, and the Left Alliance and the Finns Party had most unemployed candidates.
Nearly all elected MPs, or 93.5 per cent, were employed at the end of 2012. Of the elected MPs, 3.5 per cent were pensioners and 2.5 per cent were studying.
Figure 13. Persons entitled to vote, candidates (by party) and elected MPs by main type of activity in Parliamentary elections 2015, %
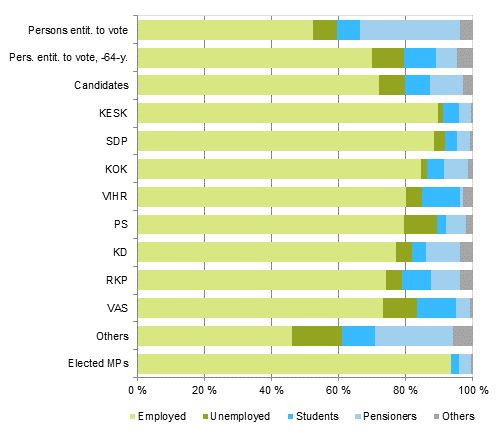
Table 7. Persons entitled to vote and candidates (by party) and elected MPs by main type of activity in Parliamentary elections 2015, %
| Party | Total | Employed | Unemployed | Students | Pensioners | Others |
| Persons entitled to vote |
100.0 | 52.4 | 7.1 | 7.0 | 29.9 | 3.7 |
| Persons entitled to vote, 18 to 64 years |
100.0 | 69.9 | 9.6 | 9.5 | 6.5 | 4.5 |
| Candidates | 100.0 | 72.2 | 7.7 | 7.3 | 10.0 | 2.9 |
| Centre Party of Finland KESK |
100.0 | 89.7 | 1.4 | 4.7 | 3.7 | 0.5 |
| Finnish Social Democratic Party SDP |
100.0 | 88.4 | 3.2 | 3.7 | 3.7 | 0.9 |
| National Coalition Party KOK |
100.0 | 84.6 | 1.9 | 5.1 | 7.0 | 1.4 |
| Green League VIHR |
100.0 | 80.2 | 4.8 | 11.1 | 1.0 | 2.9 |
| Finns Party PS |
100.0 | 79.5 | 9.8 | 2.8 | 6.0 | 1.9 |
| Christian Democrats in Finland KD |
100.0 | 77.1 | 4.7 | 4.2 | 10.4 | 3.6 |
| Swedish People's Party in Finland RKP |
100.0 | 74.0 | 4.8 | 8.7 | 8.7 | 3.8 |
| Left Alliance VAS |
100.0 | 73.1 | 10.2 | 11.6 | 4.2 | 0.9 |
| Others | 100.0 | 46.2 | 14.9 | 9.9 | 23.1 | 5.9 |
| Elected MPs | 100.0 | 93.5 | 0.0 | 2.5 | 3.5 | 0.5 |
Highest employment rate among candidates of the Centre Party of Finland, the Finnish Social Democratic Party, and the National Coalition Party
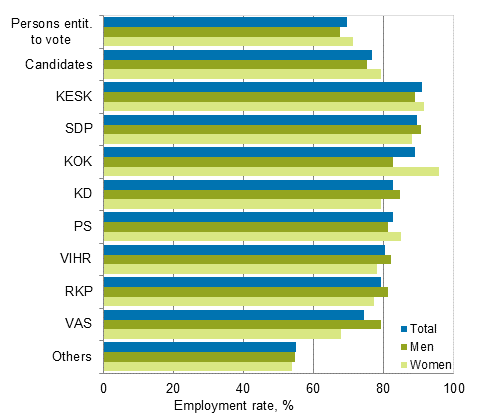
The employment rate refers to the ratio of employed persons to the population of a particular age, usually the age group 15 to 64 is used. Here, the employment rate has been calculated for the age group 18 to 64. The employment rate of persons entitled to vote is 69.6 per cent (Figure 14). The employment rate of candidates was clearly higher. The employment rate of all candidates was 77.1 per cent. The employment rate was highest among candidates of the Centre Party of Finland, the Finnish Social Democratic Party, and the National Coalition Party: their employment rate was around 90 per cent. The Left Alliance had the lowest employment rate among parliamentary parties, 74.4 per cent.
Women's employment rate is usually higher. The employment rate of women entitled to vote is 3.7 percentage points higher than that of men, and the rate of women candidates was 4.1 percentage points higher than that of men candidates. There are, however, differences between the parties. Women's employment rate was higher than men's employment rate for the candidates of the National Coalition Party, the Finns Party and the Centre Party of Finland. The employment rate was highest for the women candidates of the National Coalition Party, nearly 96 per cent.
Figure 14. Employment rate of persons entitled to vote and candidates by party in Parliamentary elections 2015, share of employed persons aged 18 to 64, %
Majority of employed candidates were salaried employees
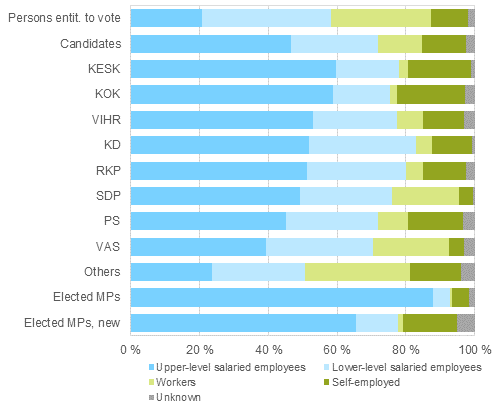
Around 70 per cent of employed candidates were salaried employees. Around 58 per cent of employed persons entitled to vote belong to this group. The Christian Democrats in Finland and the Swedish People's Party in Finland had most salaried employees as candidates (around 80 per cent). For all parliamentary parties, the proportion of salaried employees was higher among candidates than among persons entitled to vote. However, the number of salaried employees among candidates of parties outside the parliament and constituency associations was clearly lower. (Figure 13)
One in ten persons entitled to vote and slightly more of the candidates (13%) are self-employed. Most candidates with entrepreneurial background were found in the National Coalition Party, Centre Party of Finland and the Finns Party. The socio-economic group of 29 per cent of persons entitled to vote is worker. A clearly smaller proportion of candidates belonged to this group (12.9%). The Left Alliance and the Finnish Social Democratic Party had most worker candidates. Of candidates outside the parliamentary parties, the proportion of workers was very close to that of persons entitled to vote.
Nearly 90 per cent of the elected MPs were upper-level salaried employees. Five per cent have an entrepreneurial background and 0.6 per cent are in worker occupations. The majority of new elected MPs, or two-thirds, are upper-level salaried employees as well. (Figure 15)
Figure 15. Persons entitled to vote, candidates (by party) and elected MPs by socio-economic group in Parliamentary elections 2015, %
The central government sector employed candidates more than persons entitled to vote
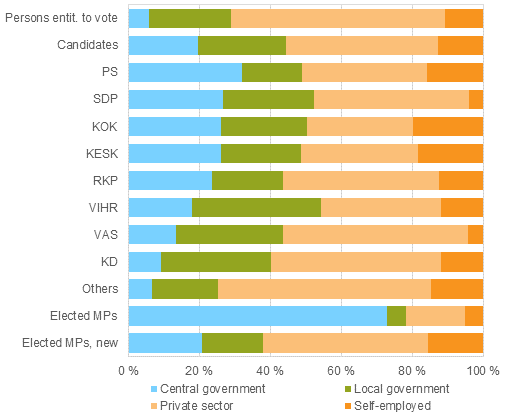
Of employed candidates, 45 per cent worked in the public sector. Roughly the same proportion of candidates and persons entitled to vote worked in the local government sector but the central government sector employed clearly more MP candidates than persons entitled to vote. When around six per cent of all persons entitled to vote work in the central government sector, among candidates their proportion was nearly one-fifth. This is largely explained by the fact that 159 of the candidates are Members of Parliament who are thus employed by the central government sector. If we only examine candidates who were not Members of Parliament, the proportion of employees in the central government sector was still emphasised among candidates: 10.6 per cent of new candidates worked in the central government sector. (Figure 16)
The employer sector of the candidates varies significantly by party. The Finns Party (32.2%) had most candidates working in the central government sector and the Christian Democrats in Finland had least (9.2%). Most local government sector employees were found among the candidates in the Green League (36.3%) and most private sector employees among candidates in the Left Alliance (52.1%). The National Coalition Party (19.8%) and the Centre Party of Finland (18.3%) had most self-employed candidates.
Over one-half of new elected MPs are representatives of the private sector
The majority, or over 70 per cent, of the elected MPs work in the central government sector, which is explained by the re-election of the current MPs. In contrast, the biggest share of new MPs are from the private sector, that is, wage and salary earners (46.6%) or self-employed (15.5%). Of new MPs, 19.0 per cent are wage and salary earners in the central government sector and 17.7 per cent in the local government sector.
Figure 16. Persons entitled to vote, candidates (by party) and elected MPs by employer sector in Parliamentary elections 2015, %
1.6. Family status
One-quarter of persons entitled to vote and one-fifth of candidates live alone
The candidates also differed in their family status from persons entitled to vote: considerably more of them were parents of a family with children and clearly less were childless couples than was the case among persons entitled to vote. This is of course explained by that the age structure of candidates was younger than among persons entitled to vote. For a majority of those entitled to vote, children have already moved from home, while most candidates were at an age when children are still living at home.
Of all persons entitled to vote, nearly one-quarter are parents living in two-parent families. Four per cent of all persons entitled to vote are single parents. Of persons entitled to vote, approximately 33 per cent are childless couples, close on 25 per cent live alone without a family, and around eight per cent are young adults living at home. The remaining roughly five per cent are persons without a family living together with others, are homeless or in the institutional population.
The National Coalition Party and the Centre Party of Finland had most candidates that are parents living in two-parent families. Around one-half of the candidates in these parties belonged to this group. The Left Alliance had least candidates that are parents of a married/cohabiting family. Of all candidates, 5.6 per cent were single parents. The Finnish Social Democratic Party and the Green League had most candidates in this group, slightly over seven per cent. (Figure 17, Table 8)
The Swedish People's Party in Finland (13.5%) and the Centre Party of Finland (8.4%) had most candidates that are young adults living at home. The Left Alliance and the Finns Party had most candidates that live alone without a family, around one-fifth.
Altogether, 44 per cent of persons entitled to vote are married and 15 per cent cohabit. Of the candidates, nearly one-half were married and 14 per cent cohabit. The candidates of the Christian Democrats in Finland differ most from the voters in that 75 per cent of them were married. The Green League (46.2%) and the Left Alliance (49.1%) had least married candidates. The Green League and the Finnish Social Democratic Party had most cohabiting candidates.
Over one-half of elected MPs are parents
Over one-half of the elected MPs are parents, that is, they are living together with their children in the same family. Of the elected women, as many as 60 per cent are living in a one or two-supporter family with their children, while this is so for around 45 per cent of the elected men. More of the elected men than women are couples without children living at home. Of the elected men, 30.2 per cent belong to this group and of women, 21.7 per cent. (Figure 17, Table 8)
Figure 17. Persons entitled to vote, candidates (by party) and elected MPs by family status in Parliamentary elections 2015, %
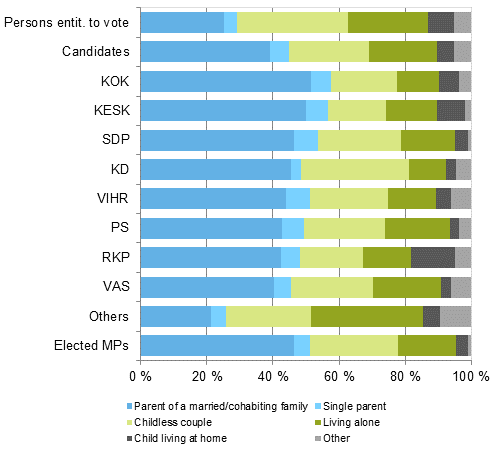
Table 8. Persons entitled to vote and candidates (by party) and elected MPs by family status in Parliamentary elections 2015, %
| Party | Total | Parent of a married/ cohabiting family |
Single parent |
Childless couple |
Living alone |
Young adult living at home |
Other |
| Persons entitled to vote |
100.0 | 25.1 | 4.0 | 33.5 | 24.4 | 7.8 | 5.2 |
| Candidates | 100.0 | 39.2 | 5.6 | 24.2 | 20.5 | 5.2 | 5.1 |
| National Coalition Party KOK |
100.0 | 51.4 | 6.1 | 20.1 | 12.6 | 6.1 | 3.7 |
| Centre Party of Finland KESK |
100.0 | 50.0 | 6.5 | 17.8 | 15.4 | 8.4 | 1.9 |
| Finnish Social Democratic Party SDP |
100.0 | 46.3 | 7.4 | 25.0 | 16.2 | 4.2 | 0.9 |
| Christian Democrats in Finland KD |
100.0 | 45.3 | 3.1 | 32.8 | 10.9 | 3.1 | 4.7 |
| Green League VIHR |
100.0 | 44.0 | 7.2 | 23.7 | 14.5 | 4.3 | 6.7 |
| Finns Party PS |
100.0 | 42.8 | 6.5 | 24.7 | 19.5 | 2.8 | 3.7 |
| Swedish People's Party in Finland RKP |
100.0 | 42.3 | 5.8 | 19.2 | 14.4 | 13.5 | 4.8 |
| Left Alliance VAS |
100.0 | 40.3 | 5.1 | 25.0 | 20.4 | 3.2 | 6.0 |
| Others | 100.0 | 21.3 | 4.4 | 25.7 | 33.9 | 5.1 | 9.6 |
| Elected MPs | 100.0 | 46.2 | 5.0 | 26.6 | 17.6 | 3.5 | 1.0 |
| Men | 100.0 | 42.2 | 2.6 | 30.2 | 18.1 | 5.2 | 1.7 |
| Women | 100.0 | 51.8 | 8.4 | 21.7 | 16.9 | 1.2 | 0.0 |
1.7. Number of children
Candidates of Christian Democrats in Finland had most children
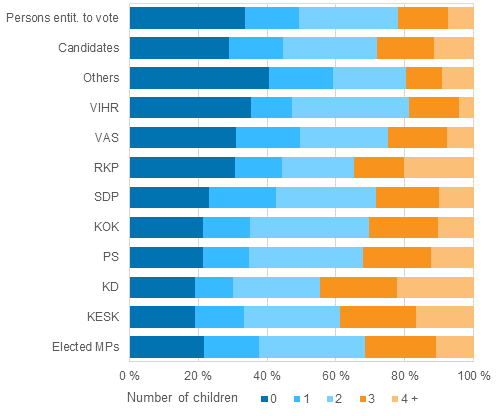
Although the majority of persons entitled to vote and many candidates are not at the moment going through the everyday life of a family with children, it does not mean that they do not have experiences of it. Nearly 35 per cent of persons entitled to vote have never had or do not yet have children of their own, while about 30 per cent of the candidates were completely childless. The Christian Democrats had the lowest proportion of candidates without children, only around 20 per cent. (Figure 18)
Figure 18. Persons entitled to vote, candidates (by party) and elected MPs by number of children in Parliamentary elections 2015, %
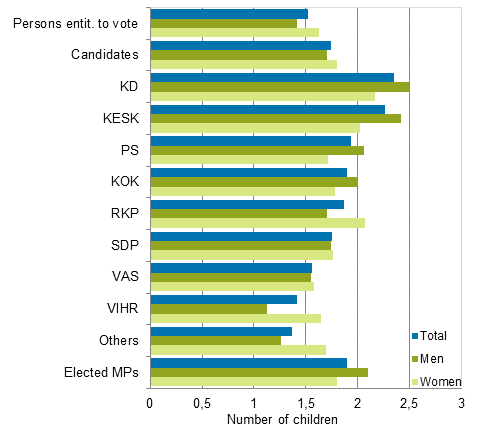
On average, female candidates had 1.8 children and male candidates 1.7 children (Figure 17). Women entitled to vote have on average 1.6 children and men 1.4. These figures include all biological and adopted children of the person regardless of their age or whether they still live at home.
Around one-fifth of the elected MPs are childless among both men and women. In all, 7.2 per cent of the elected women and 13.8 per cent of the men have more than three children. On average, elected women MPs have 1.8 and men 2.1 children.
Figure 19. Persons entitled to vote, candidates (by party) and elected MPs by number of children (on average) in Parliamentary elections 2015
1.8. Income level
Candidates from National Coalition Party and the Centre Party had the highest income
The following examines the candidates and the persons entitled to vote by their disposable income. The income data derive from the latest taxation data from 2013. The income concept used is disposable monetary income. Income refers to the monetary income after taxes and consists of earned income, property income, and transfer income.
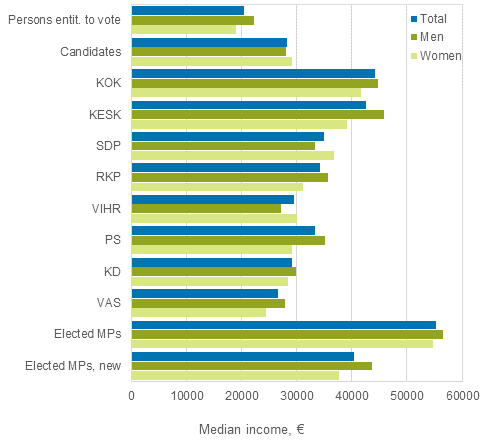
The median disposable income of the candidates was EUR 28,290 and that of all persons entitled to vote was EUR 20,390 (Figure 20). The candidates' disposable income was on average 40 per cent higher than of all persons entitled to vote.
The National Coalition Party and the Centre Party candidates had the biggest income difference with persons entitled to vote, as their disposable income was more than two times higher compared with persons entitled to vote. The income of candidates in the Finnish Social Democrats and the Swedish People's Party in Finland was around 70 per cent higher than that of those entitled to vote. Of the parliamentary parties, the Left Alliance was closest to the voters with a EUR 26,600 disposable income.
The median for the disposable monetary income of all elected MPs is EUR 55,200 per year. The average disposable monetary income among the elected MPs is clearly higher than among persons entitled to vote or candidates. Compared to persons entitled to vote, the disposable income of elected MPs is 2.7 times higher and compared to candidates, around two times higher. New elected MPs also have higher income than those entitled to vote and candidates, their monetary income being around EUR 40,400.
Figure 20. Median disposable income of persons entitled to vote, candidates (by party) and elected MPs in Parliamentary elections 2015, EUR per year
When the population entitled to vote is arranged according to income and divided into ten equal parts, the income deciles of the population entitled to vote are generated. Each decile contains around 422,500 persons. The highest-income decile of the population entitled to vote has at least EUR 37,900 at their disposal and the lowest-income decile at most EUR 8,300.
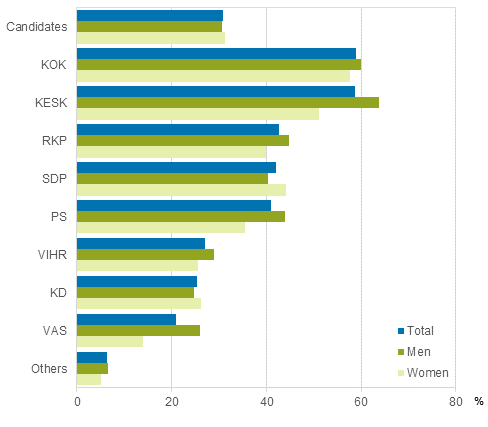
Of all candidates, 30 per cent belonged to the highest-income decile. Of the candidates, those representing the National Coalition Party, the Centre Party of Finland, the Swedish People's Party in Finland, the Finnish Social Democrats, and the Finns Party belonged to the higher end of the income distribution. Of them, more than 40 per cent belonged to the highest-income decile, and of the National Coalition Party and the Centre Party of Finland candidates as many as nearly 60 per cent. (Figures 21 and 22, Table 9)
Figure 21. Candidates (by party) belonged to the highest income decile in Parliamentary elections 2015, % of the party’s candidates (disposable monetary income)
One-tenth of all persons entitled to vote thus belonged to the lowest-income decile. Of the candidates, slightly fewer, around nine per cent, belong to this decile. Of the candidates of parties outside the Parliament and constituency associations 16.6 per cent belonged to the lowest-income decile, and of the Swedish People's Party in Finland, 10.7 per cent. The Finnish Social Democrats had the least candidates belonging to the lowest-income decile, only 2.3 per cent.
Figure 22. Candidates (by party) belonged to the lowest income decile in Parliamentary elections 2015, % of the party’s candidates (disposable monetary income)
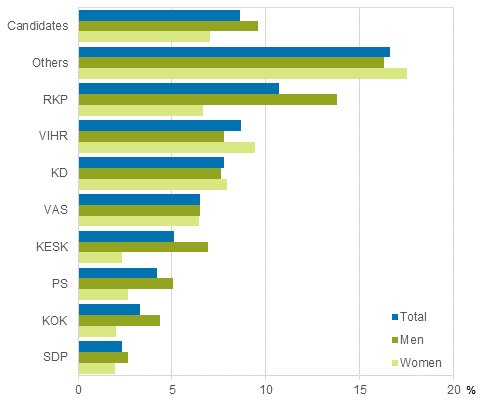
Table 9. Candidates belonged to the highest and lowest-income decile by party in Parliamentary elections 2015, % of the party’s candidates
| Party | Highest–income decile | Lowest–income decile | ||||
| Total | Men | Women | Total | Men | Women | |
| Candidates | 30.9 | 30.6 | 31.3 | 8.6 | 9.6 | 7.0 |
| National Coalition Party KOK |
58.9 | 60.0 | 57.6 | 3.3 | 4.3 | 2.0 |
| The Finnish Social Democratic Party SDP |
42.1 | 40.4 | 44.1 | 2.3 | 2.6 | 2.0 |
| The Finns Party PS |
40.9 | 43.9 | 35.5 | 4.2 | 5.0 | 2.6 |
| Centre Party of Finland KESK |
58.8 | 63.8 | 51.2 | 5.1 | 6.9 | 2.3 |
| The Left Alliance VAS |
20.8 | 26.0 | 14.0 | 6.5 | 6.5 | 6.5 |
| Green League VIHR |
27.1 | 28.9 | 25.6 | 8.7 | 7.8 | 9.4 |
| Swedish People's Party in Finland RKP |
42.7 | 44.8 | 40.0 | 10.7 | 13.8 | 6.7 |
| Christian Democrats in Finland KD |
25.4 | 24.8 | 26.1 | 7.8 | 7.6 | 8.0 |
| Others | 6.3 | 6.6 | 5.1 | 16.6 | 16.3 | 17.5 |
Source: Parliamentary Elections 2015, confirmed result, background analysis of candidates and elected MPs. Statistics Finland
Inquiries: Sami Fredriksson 029 551 2696, Kaija Ruotsalainen 029 551 3599, Jaana Asikainen 029 551 3506, vaalit@stat.fi
Director in charge: Riitta Harala
Updated 30.4.2015
Official Statistics of Finland (OSF):
Parliamentary elections [e-publication].
ISSN=1799-6279. 2015,
1. Background analysis of candidates and elected MPs in the Parliamentary elections 2015
. Helsinki: Statistics Finland [referred: 14.2.2026].
Access method: http://stat.fi/til/evaa/2015/evaa_2015_2015-04-30_kat_001_en.html

