Published: 30 April 2015
The Centre Party of Finland victorious in the Parliamentary elections 2015
Corrected on 30 April 2015 at 10:30 am. Figure 2. of the release has been corrected.
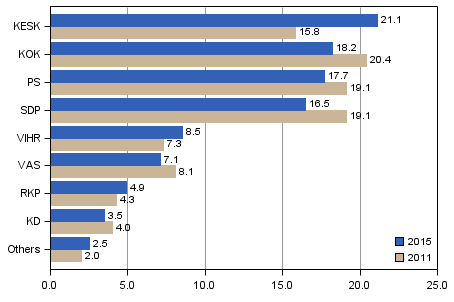
The Centre Party of Finland emerged as the winner of the elections as the Social Democrats, the National Coalition Party and the Finns Party lost support compared with the previous Parliamentary elections. The Centre Party of Finland increased its support by 5.3 percentage points, thus gaining 21.1 per cent of the whole country's votes, which raised it to the largest party in Finland. The number of votes cast for the Centre Party of Finland gave it 14 additional seats in Parliament. In total, the Centre Party of Finland got 49 MPs and a total of 626,218 votes in the whole country, which is 162,952 more votes than in the Parliamentary elections 2011.
Support for parties in Parliamentary elections 2015 and 2011

The Finns Party got the second most MPs. Measured by the number of votes, the party came third. The party got 17.6 per cent of all the votes cast. When compared with the previous Parliamentary elections, its support went down by 1.4 percentage points. The party received 524,054 votes and got 38 MPs. The number of seats for the party fell by one and the number of votes by 36,021 compared with the 2011 Parliamentary elections.
The National Coalition Party was the third largest party measured by the number of MPs. Measured by the number of votes, the Coalition Party was the second largest. The party gained 37 seats and 18.2 per cent of the votes cast. The party lost seven MPs and received 2.2 percentage points fewer votes than in the previous Parliamentary elections. In the whole country, the Coalition Party received 540,212 votes, which is 58,926 down from 2011.
The Finnish Social Democratic Party fell to the fourth place. The party gained 16.5 per cent of the votes and 34 seats, which is 2.6 percentage points and eight seats down from the 2011 elections. The Social Democrats got 490,102 votes, which is 71,456 fewer votes than in the previous Parliamentary elections.
The Green League gained 8.5 per cent of all votes cast and got 15 seats. The number of votes cast for the party increased by 1.3 percentage points and the number of seats went up by five. The party's result was almost the same as in the 2007 Parliamentary elections. The Swedish People's Party got 4.9 per cent of the votes casts, which is 0.6 percentage points up from the previous Parliamentary elections. The party retained its nine seats. The Left Alliance gained 7.1 per cent of all votes cast and 12 seats. Compared with the previous Parliamentary elections, the number of votes fell by 1.0 percentage points and the number of MPs by two. The Christian Democrats gained 3.5 per cent of the votes, or 0.5 percentage points down from the previous Parliamentary elections. The Christian Democrats lost one seat, thus gaining five MPs in Parliament. No new parties entered the Parliament in the 2015 Parliamentary elections.
Election participation on level with the previous Parliamentary elections
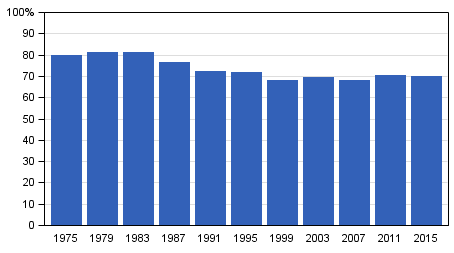
The voting percentage of Finnish citizens resident in Finland was 70.1, which is 0.4 percentage points less than in the Parliamentary elections in 2011. The voting turnout increased in the constituencies of ┼land, Lapland, Central Finland and Oulu. The voting turnout was highest in the constituency of Helsinki, where 75.1 per cent of persons entitled to vote cast their vote. The voting turnout was also higher than average in the constituencies of Uusimaa (72.4%), Vaasa (72.0%), Varsinais-Suomi (71.0%) and Pirkanmaa (70.5%).
The total number of persons entitled to vote was 4,463,333. The number of persons entitled to vote resident in Finland was 4,221,237 and the number of persons entitled to vote resident abroad was 242,096. The voting turnout of Finnish citizens resident abroad was 10.1 per cent, which is 0.5 percentage points lower than in the previous Parliamentary elections.
Voting turnout of Finnish citizens resident in Finland in Parliamentary elections 1975 - 2015, %. The figure has been corrected.

Turnout in Parliamentary elections 1975-2015, %
| Year | Finnish citizens living in Finland |
Finnish citizens living abroad |
| 1975 | 79.7 | 7.1 |
| 1979 | 81.2 | 6.7 |
| 1983 | 81.0 | 6.7 |
| 1987 | 76.4 | 5.8 |
| 1991 | 72.1 | 5.6 |
| 1995 | 71.9 | 6.1 |
| 1999 | 68.3 | 6.5 |
| 2003 | 69.7 | 8.8 |
| 2007 | 67.9 | 8.6 |
| 2011 | 70.5 | 10.6 |
| 2015 | 70.1 | 10.1 |
Statistics Finland’s election result services
Before the elections, on 10 April 2015, Statistics Finland released a review on the background of the candidates analysing the candidates' sex distribution, age, origin, education, employment, income level and family status in comparison to persons entitled to vote. The review will be supplemented on 30 April 2015 with background data on the elected MPs, in connection with the release of the confirmed election results.
On 21 April 2015, Statistics Finland opened a free of charge election map service on the web containing data illustrated by maps and charts on the Parliamentary elections. The themes include voting turnout, the party with the most votes, support for parties and change in the support, and the elected MPs by constituency. The data can be browsed by various area categories such as municipalities, constituencies and the largest towns by voting district. The map data will be updated with the confirmed election results on 30 April 2015.
More detailed election result data are available in Statistics Finland's PX-Web database service where users can compile customised statistical tables on the elections. Database tables on the preliminary Parliamentary election data will be produced on 21 April 2015. Database tables according to the confirmed results of the Parliamentary elections will be released on 30 April 2015.
Statistics Finland will publish a background analysis on 30 April 2015 that describes the advance voters with respect to persons entitled to vote. The analysis is based on the data from the voting register (Population Register Centre) and from Statistics Finland's Population and Social Statistics Department. Information is entered in the voting register on the voting of all advance voters. The background data on the persons combined with the voting register are based on statistical data from Statistics Finland's Population and Social Statistics Department, such as employment statistics, the Register of Completed Education and Degrees, and family statistics.
Source: Parliamentary Elections 2015, confirmed result, background analysis of candidates and elected MPs. Statistics Finland
Inquiries: Sami Fredriksson 029 551 2696, Kaija Ruotsalainen 029 551 3599, Jaana Asikainen 029 551 3506, vaalit@stat.fi
Director in charge: Riitta Harala
Publication in pdf-format (786.8 kB)
- Reviews
- Tables
-
Tables in databases
Pick the data you need into tables, view the data as graphs, or download the data for your use.
Appendix tables
- Quality descriptions
-
- Parliamentary elections, quality description (30.4.2015)
Updated 30.4.2015
Official Statistics of Finland (OSF):
Parliamentary elections [e-publication].
ISSN=1799-6279. 2015. Helsinki: Statistics Finland [referred: 18.2.2026].
Access method: http://stat.fi/til/evaa/2015/evaa_2015_2015-04-30_tie_001_en.html

