Published: 31 August 2018
Mining and construction increased the total amount of waste in 2016
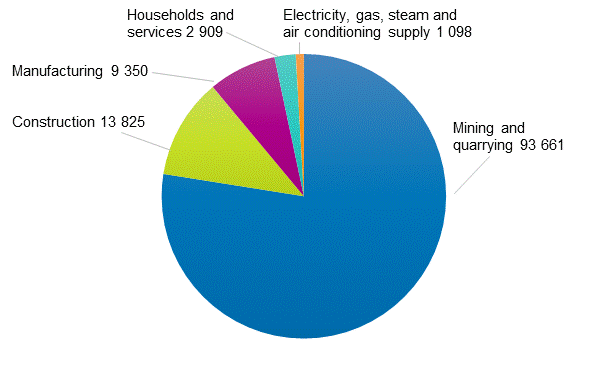
Increased mineral excavation raised the total amount of waste to around 123 million tonnes in 2016. The share of mineral excavation in the total waste generated was good 93 million of surface soil, waste stone and dressing sand. The amount of all waste grew by around 15 per cent, and that of hazardous waste by about 14 per cent from 2015.
Waste generated by sector and type in 2016, 1,000 tonnes per year

Construction is another industry that generates considerable amount of mineral waste, but its amounts of soil mass classified as waste decreased simultaneously to around 12 million tonnes. The amount of other construction waste remained unchanged at nearly 1.8 million tonnes. According to the statistics, materials recovery of surplus soils from construction appears not to have increased, and the generated soil mass had to be deposited at landfills more than before.
The total amount of waste in industrial production and the energy sector grew by 2.9 per cent (by close on 300,000 tonnes) to 10.4 million tonnes.
The moderate growth of waste amounts in production is in line with the development of the quantity of municipal waste. The amount of municipal waste increased from 2.74 to 2.77 million tonnes, that is, by good one per cent.
The combined amount of waste from services and households grew to around 2.9 million tonnes.
In waste treatment, the increased amount of waste was visible as growth in the amounts of waste treated. There were no actual new trends between different modes of treatment, but as in previous years, energy recovery of waste increased and landfill disposal decreased when comparing waste amounts without mineral waste generated from mining and construction.
Without mineral waste, around 47 per cent of waste was utilised by energy recovery and about 41 per cent by materials recovery, slightly under 11 per cent ended up at landfill sites. Although the relative share of materials recovery of waste fell slightly and the share of energy recovery rose, in absolute numbers, a 1.3-fold amount of waste was utilised by materials recovery in 2016 compared with the previous year.
In recent years, the EU has tended to monitor the development of waste amounts and modes of treatment without amounts of mineral waste, because their large amount compared to any other waste easily hides any changes possibly occurring in the amounts and treatment of other waste.
Source: Waste statistics 2016, Statistics Finland
Inquiries: Juha Espo 029 551 3463, Johanna Pakarinen 029-5513313, ymparistotilinpito@stat.fi
Director in charge: Ville Vertanen
- Tables
-
Tables in databases
Pick the data you need into tables, view the data as graphs, or download the data for your use.
Appendix tables
Updated 31.8.2018
Official Statistics of Finland (OSF):
Waste statistics [e-publication].
ISSN=2323-5314. 2016. Helsinki: Statistics Finland [referred: 5.2.2026].
Access method: http://stat.fi/til/jate/2016/jate_2016_2018-08-31_tie_001_en.html

