1. Review of general government expenditure by function (translation added 18.3.2013)
Consolidated total general government expenditure grew by 4.6 per cent in 2011. However, the share of expenditure of GDP decreased, because gross domestic product in nominal terms grew faster than general government expenditure. Total expenditure amounted to EUR 104.3 billion, 55.0 per cent relative to GDP. In the previous year, the share of total expenditure of GDP was 55.8 per cent. Expenditure increased by EUR 4.6 billion from the previous year.
The biggest function group was social protection, whose expenditure totalled EUR 44.9 billion. The next biggest function groups were health (EUR 14.8 billion), general public services (EUR 13.9 billion) and education (EUR 12.1 billion). The expenditure of social protection grew most from 2010.
The function group of social protection is divided into nine sub-groups. The biggest of these is old age, on which EUR 21.7 billion was spent. It was at the same time the most grown sub-group in 2011. The expenditure from the function group of old age mainly consists of pensions. The second most expenditure in the sub-groups of social protection was spent on sickness and functional limitations (EUR 9.1 billion) and the third most on families and children (EUR 5.3 billion). The expenditure on unemployment went down by EUR 0.5 billion and amounted to EUR 3.9 billion in 2011.
1.1 Share of expenditure of gross domestic product has varied
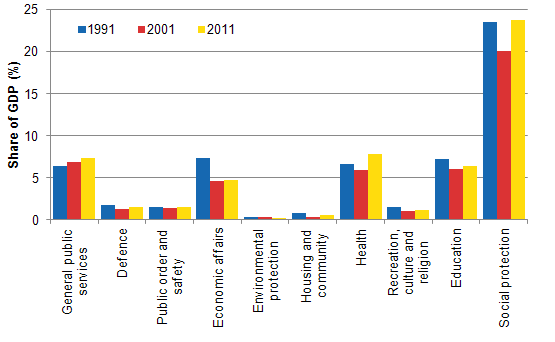
The share of total expenditure of GDP has changed somewhat during the past 20 years. The share of total expenditure of GDP was 57.1 per cent in 1991 and 48.0 per cent in 2001. The share of expenditure of GDP rose strongly in 2009, but it has fallen after that. Social protection has remained clearly the biggest function group throughout the examined period. Expenditure intended for economic affairs has decreased most, by 2.6 percentage points relative to GDP from 1991. Compared with 2001, it has remained on the same level, however. The share of health expenditure of GDP has grown by 1.1 percentage points compared with 1991 and by 1.9 percentage points compared with 2001.Figure 1. Share of total general government expenditure of GDP by function in 1991, 2001 and 2011

1.2 Functions of general government sub-sectors differ from each other
General government divides into three sectors: central government, local government and social security funds, which include employment pension schemes and other social security funds. Local government mainly refers to municipalities and joint municipal authorities. The function structure of each sector is different.
Expenditure in the sub-sectors of general government can be examined as unconsolidated or consolidated. When expenditure is consolidated, current transfers, capital transfers and property expenditure between sub-sectors are removed. Total general government expenditure is usually examined consolidated and that of sub-sectors unconsolidated.
When viewing unconsolidated total expenditure, central government expenditure is the largest one. Unconsolidated central government expenditure grew by 2.2 per cent in 2011. The biggest function groups in central government are social protection and general public services. Measured by consolidated expenditure, central government is the third biggest sector, as it makes large current transfers to the rest of general government.
With its unconsolidated total expenditure, local government is the second largest sector. In 2011, the sector's expenditure grew by 5.7 per cent. The majority of local government expenditure belongs to the function group of health. The next biggest ones are social protection and education expenditure.
The sub-sector of social security funds is the smallest sub-sector measured by its unconsolidated expenditure. The sector's unconsolidated expenditure grew by five per cent in 2011. The majority of the expenditure there is related to social protection. Most of this comprises of social benefits in cash. A small part of the expenditure is directed to studying and health care.
1.3 Expenditure structures of function groups are different
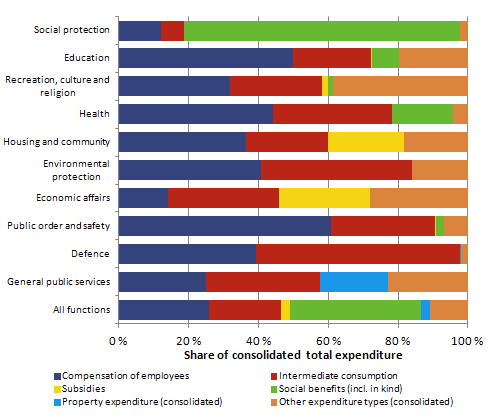
In the statistics, total general government expenditure is also divided into types of expenditure according to national accounts. The most important of these are compensation of employees, intermediate consumption, social benefits in cash and in kind, gross capital formation, capital and current transfers, and property expenditure.Figure 2. Share of expenditure types of consolidated total general government expenditure by function in 2011

The structure of total expenditure by function group varies much between the functions (Figure 2). Compensation of employees is the most significant expenditure type in the functions of public order and safety, education, and health. Intermediate consumption or purchased services and goods are particularly large in the functions of defence, general public services, and health.
The biggest part of social protection expenditure is comprised of social benefits in cash and kind. Subsidies form a significant part of the functions of economic affairs and housing, as well as community amenities. Servicing of public debt and other property expenditure go under the function category of general public services.
Source: National Accounts, Statistics Finland
Inquiries: Jukka Hytönen 09 1734 3484, skt.95@stat.fi
Director in charge: Leena Storgårds
Updated 31.1.2013
Official Statistics of Finland (OSF):
General government expenditure by function [e-publication].
ISSN=1798-0828. 2011,
1. Review of general government expenditure by function (translation added 18.3.2013)
. Helsinki: Statistics Finland [referred: 22.2.2026].
Access method: http://stat.fi/til/jmete/2011/jmete_2011_2013-01-31_kat_001_en.html

