Published: 25 November 2014
Value of the mass media market continued to fall
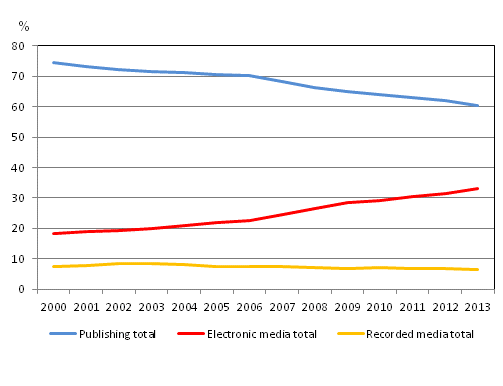
In 2013, the value of the mass media market amounted to around EUR 4.1 billion. It was nearly EUR 150 million and over three per cent less than in the year before. Publishing activities and recorded media went down by six per cent. Electronic media grew by two per cent. The share of publishing in the mass media market has fallen by nearly 15 percentage points from the turn of the millennium.
Shares of different sectors of the mass media market in 2000 to 2013 (%)

Except for television and web media advertising, year-on-year changes have been negative for all mass media sectors. The biggest drops concerned daily newspapers (-9%) and video recordings (-11%). For magazines and periodicals, the share of advertising revenues has dropped from 33 to 20 per cent over the 2000s. For daily newspapers, the share has fallen from 58 to 47 per cent. According to TNS Gallup data, newspaper and magazine advertising went down by around 15 per cent in 2013.
Mass media market in 2012 to 2013, EUR million
| 2012, EUR mill. | 2013, EUR mill. | 2013, % | Change, 2012-13, % | |
| Daily newspapers (7-4 times a week) 1) | 996 | 911 | 22 | -9 |
| Other newspapers 1) | 136 | 132 | 3 | -3 |
| Free-distribution papers 1) | 76 | 73 | 2 | -4 |
| Magazines and periodicals | 650 | 610 | 15 | -6 |
| Books 1) | 563 | 554 | 13 | -2 |
| Direct mail | 224 | 207 | 5 | -8 |
| Publishing, total | 2 646 | 2 487 | 60 | -6 |
| Television 2) | 1 055 | 1 075 | 26 | 2 |
| Radio | 58 | 55 | 1 | -5 |
| Internet advertising | 222 | 238 | 6 | 7 |
| Electronic media, total | 1 336 | 1 368 | 33 | 2 |
| Phonograms 1) | 77 | 77 | 2 | -1 |
| Videos | 124 | 110 | 3 | -11 |
| Cinemas | 81 | 77 | 2 | -4 |
| Recorded media, total | 282 | 264 | 6 | -6 |
| All total | 4 263 | 4 119 | 100 | -3 |
2) Also includes YLE public service radio.
The calculations presented here describe the mass media market at end user level: for example, the figure on the newspaper market is comprised of retail priced subscription and single copy sales of newspapers, and their revenue from advertising. The figures cover domestic production and imports but not exports. There is some overlap between internet advertising and newspapers.
Source: Mass media and cultural statistics. Statistics Finland
Inquiries: Tuomo Sauri 029 551 3449, joukkoviestimet.tilastokeskus@stat.fi
Director in charge: Riitta Harala
Publication in pdf-format (254.5 kB)
- Tables
-
Tables in databases
Pick the data you need into tables, view the data as graphs, or download the data for your use.
Appendix tables
- Appendix table 1. Sector shares of the mass media market 2000 - 2012, per cent (25.11.2014)
- Appendix table 2. Breakdown of newspaper sales 2000 - 2013, per cent (25.11.2014)
- Appendix table 3. Breakdown of magazine sales 2000 - 2013, per cent (25.11.2014)
- Appendix table 4. Radio advertising 2000 - 2013, per cent (25.11.2014)
- Appendix table 5. Television (terrestrial + cable + satellite) revenue 2000 - 2013, per cent (25.11.2014)
Updated 25.11.2014
Official Statistics of Finland (OSF):
Mass media statistics [e-publication].
ISSN=2323-6345. 2013. Helsinki: Statistics Finland [referred: 19.2.2026].
Access method: http://stat.fi/til/jvie/2013/jvie_2013_2014-11-25_tie_001_en.html

