This set of statistics has been discontinued.
Statistical data on this topic are published in connection with another set of statistics.
Data published after 5 April 2022 can be found on the renewed website.
Published: 31 March 2014
Growth in general government’s net financial assets continued in the last quarter of 2013 thanks to employment pension schemes
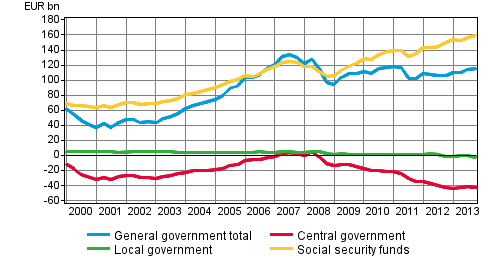
General government’s total net financial assets, or the difference between assets and liabilities, increased from EUR 114.8 billion to EUR 115.2 billion during the last quarter of 2013. During 2013, the growth amounted to EUR 8.6 billion. As the debts of local and central government grew by more than the assets, the growth in net financial assets mainly derived from holding gains accrued by employment pension schemes and other social security funds. These data derive from general government financial accounts compiled by Statistics Finland.
General government’s net financial assets

Even though an increase in the market value of shareholdings and growth in deposit assets slightly increased central government’s financial assets in the last quarter of 2013, its balance sheet position weakened by EUR 1.2 billion as a result of issuing of bonds. Central government's financial assets stood at EUR -42.6 billion at the end of 2013.
The financial assets of employment pension schemes and other social security funds stood at EUR 164.2 billion at the end of 2013. The assets grew by EUR 3.1 billion during the quarter, which also resulted in an increase in the net financial assets of general government. The growth in social security funds' assets is mainly explained by holding gains accrued from quoted shares and mutual funds.
During the quarter, social security funds invested most in net amounts in mutual fund shares. Holdings in bonds also increased. Correspondingly, loan receivables were decreased similarly to previous quarters of 2013. Assets were also withdrawn from cash deposits and money market instruments.
Local government's net financial assets contracted by EUR 1.2 billion during 2013. The difference between assets and liabilities in local government grew to its lowest level of EUR -2.2 billion by the end of 2013.
Source: General government financial accounts, Statistics Finland
Inquiries: Martti Pykäri 09 1734 3382, Timo Ristimäki 09 1734 2324, rahoitus.tilinpito@stat.fi
Director in charge: Leena Storgårds
Publication in pdf-format (255.5 kB)
- Tables
-
Tables in databases
Pick the data you need into tables, view the data as graphs, or download the data for your use.
Appendix tables
- Figures
Updated 31.3.2014
Official Statistics of Finland (OSF):
General government financial accounts [e-publication].
ISSN=1798-1964. 4th quarter 2013. Helsinki: Statistics Finland [referred: 11.2.2026].
Access method: http://stat.fi/til/jyrt/2013/04/jyrt_2013_04_2014-03-31_tie_001_en.html

