Restrictive measures to prevent the spread of the coronavirus are visible in the data collection and weight structure of the Consumer Price Index in 2021
Data collection
One of the most important factors influencing the quality of the Consumer Price Index is the success of data collection in a similar manner from one month to the next. Conventionally, Consumer Price Index data have been collected by survey interviewers in different parts of Finland by so-called sample-based field collection. In addition, the interviewers’ data collection has been supplemented with a centralised price collection made by the Consumer Price Index team.
As a result of the restrictions on mobility imposed to prevent the spread of the coronavirus (COVID-19), interviewers have not been able to collect product prices as a face-to-face collection, so prices have been collected from enterprises' websites, for example. Furthermore, the data collection has been increasingly expanded to scanner data, so the conventional sample-based data collection can be replaced with more extensive data than before. At the same time, scanner data can be used to develop the quality and accuracy of the Consumer Price Index. Scanner data are already used to cover the entire price collection of pharmaceutical preparations, alcoholic beverages as well as food and other daily consumer goods in Mainland Finland.
Commodity basket
The calculation of the Consumer Price Index is based on a commodity basket that is updated annually along with changes taking place in consumption. New commodities are added to the commodity basket if their annual consumption value is at least one per mil of total consumption. Correspondingly, commodities whose value share has fallen under one per mil of total consumption are removed from the commodity basket. With the help of the annually updated commodity basket, the inclusion of representative products and services in the Index is ensured.
At the beginning of 2021, seven products were removed from the commodity basket and price collection due to low consumption. These are:
-
Scarves
-
Women’s pumps
-
Wallpaper
-
Blender
-
Repair of audio-visual, photographic and information processing equipment
-
Savoury pastry
-
Costume jewellery
During 2020, more scanner data have been obtained for the Consumer Price Index, which can be used to replace the conventional interviewer collection. As a result of this change, price data of commodities based on scanner data are taken into account in the calculation of the Consumer Price Index starting from January 2021. More extensive price data than before could be taken into use for the following commodity groups:
-
Men's and women's underwear and nightwear, socks, and sewing materials
-
Materials for the maintenance and repair of the dwelling, such as paints and varnishes
-
Lighting equipment, art objects and ornaments, household textiles, glassware and tableware, and household utensils
-
Therapeutic appliances such as blood pressure monitor
-
Accessories and lubricants for personal transport equipment
-
Games and toys, indoor equipment for sport and equipment for camping and open-air recreation
-
Miscellaneous printed matter, newspapers and periodicals
-
Flowers, plants and garden products
-
Appliances, articles and products for personal care
However, the sample-based field collection continues and it complements the data obtained from scanner data.
To ensure the data protection of enterprises, the most detailed classification level (7-digit level) used in the Consumer Price Index has been made less detailed with respect to these commodities.
Weight structure
The weight structure of the Consumer Price Index 2015=100 is primarily based on national accounts calculations on private consumption expenditure. Annual national accounts data are conventionally used in the definition of the weight structure, but this year the more speedily produced estimate of private consumption expenditure in 2020 based on quarterly data is utilised because the measures to prevent the spread of the coronavirus have clearly affected private consumption. The total value of private consumption has decreased somewhat last year and at the same time the structure of consumption has changed between the main commodity groups.
Private consumption expenditure in national accounts is divided by purpose of use category, of which 4-digit and 5-digit purpose of use categories are taken into account when defining the weight structure of the Consumer Price Index. The weight structure of the sub-categories (6-digit and 7-digit categories) is estimated on the basis of other reliable sources, such as the cost structure of the Household Budget Survey, other statistical data of producers of Official Statistics of Finland (OSF) and sales data of central retail corporations and organisations.
According to the latest data, the value of total consumption was around EUR 105 billion in 2020.
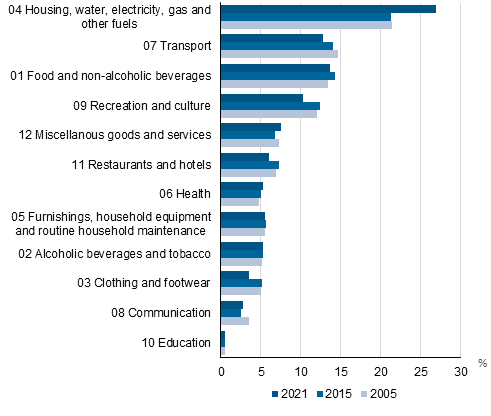
Figure 1. Value share of total consumption by commodity group in 2005, 2010 and 2021, per cent

Figure 1 shows a comparison of value shares of total consumption by main commodity group for the years 2005, 2015 and 2021. Most change has occurred in group 04 Housing, water, electricity, gas and other fuels. The group's share of total consumption has grown by 5.6 percentage points in six years. In 2015, the group’s share of total consumption was 21.3 per cent, when in 2021 the share was 26.9 per cent.
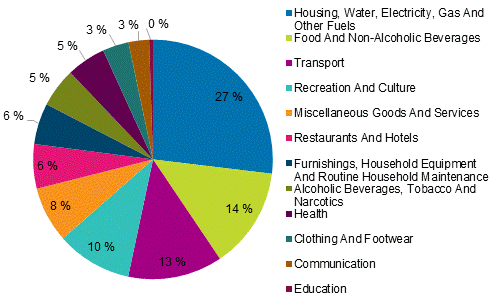
Figure 2 shows the annual structure of private consumption by main commodity group.Figure 2. Weight structure in 2021 by commodity group, per cent of total consumption

The restrictive measures to prevent the coronavirus affected private consumption in 2020. This effect is also visible in the weight structure of the Consumer Price Index when comparing the weight structure of last year with the weight structure of 2021. Table 1 shows this effect by main commodity group.
Table 1. Change in the weight structure of the Consumer Price Index from 2020 to 2021
| 2020 | 2021 | Change of consumption, % | |
| Consumer Price Index | 100.0 | 100.0 | |
| 01 Food and non-alcoholic beverages | 12.8 | 13.7 | 6.7 |
| 02 Alcoholic beverages and tobacco | 5.0 | 5.3 | 5.7 |
| 03 Clothing and footwear | 4.5 | 3.5 | -21.6 |
| 04 Housing, water, electricity, gas and other fuels | 24.9 | 26.9 | 8.0 |
| 05 Furnishings, household equipment and routine household maintenance | 5.1 | 5.5 | 8.8 |
| 06 Health | 5.2 | 5.3 | 1.9 |
| 07 Transport | 13.9 | 12.8 | -8.1 |
| 08 Communication | 2.6 | 2.8 | 6.7 |
| 09 Recreation and culture | 11.2 | 10.2 | -8.8 |
| 10 Education | 0.4 | 0.5 | 29.1 |
| 11 Restaurants and hotels | 7.6 | 6.0 | -21.3 |
| 12 Miscellanous goods and services | 7.4 | 7.5 | 1.7 |
The biggest drops in private consumption have occurred in the following main commodity groups during the year: 03 Clothing and footwear and 11 Hotels, cafes and restaurants, where private consumption decreased by good 21 per cent. A slightly more moderate drop, 8 to 9 per cent, can be seen in groups 07 Transport and 09 Culture and recreation. People stayed at home more than before, so more was invested in spending time together and well-being than before. This is visible as growing consumption of food, alcoholic beverages and household objects.
Classification of individual consumption according to purpose
In the definition of commodities, the commodity classification introduced in 2016 is used (eCOICOP, European Classification of Individual Consumption According to Purpose), which is based on the UN’s Classification of Individual Consumption According to Purpose. In accordance with EU guidelines, the commodities are divided into 5-digit level sub-groups, with the help of which the products and services are separated into own commodity groups. The Finnish national classification specifies the EU classification with 6-digit and 7-digit commodity groups. The sub-division is revised annually when new commodities are added to the commodity basket or removed from it. The eCOICOP content description and list can be found through this link on Eurostat Ramon metadatabase.
Weight structure of the Harmonised Index of Consumer prices is also revised every year
Statistics Finland has also updated the weight structure of the Harmonised Index of Consumer Prices calculated for Eurostat, the Statistical Office of the European Union. Its base year is the same as that of the national Consumer Price Index, 2015=100.
The Harmonised Indices of Consumer Prices are primarily used in price comparisons between the EU countries. The European Central Bank uses the Harmonised Index of Consumer Prices as the measure of inflation in its monetary policy.
The Finnish Harmonised Index of Consumer Prices is mainly based on the same weight and price data as the Finnish national Consumer Price Index, but its commodity selection is narrower. It does not include owner-occupancy, games of chance, interests and tax-like payments. The Harmonised Index of Consumer Prices covers 86 per cent of the national Consumer Price Index.
Table 2. Value shares of consumption items not included in the Harmonised Index of Consumer Prices in the Consumer Price Index 2015=100 in 2021
| COICOP code | Commodity/group | Weight in the CPI, o/o |
| 04.6 | Owner-occupied housing | 10.48 |
| 07.2.4.2.1.1 | Vehicle tax | 1.29 |
| 09.4.3 | Games of chance | 1.43 |
| 12.5.2.0.1.2 | Premium for fire insurance on detached houses | 0.10 |
| 12.6.2.1.1.2 | Interests on consumer credits | 0.93 |
| 12.7.0.1.1.2 | Other licences | 0.05 |
| Items removed from HICP, total | 14.28 | |
Source: Consumer Price Index, Statistics Finland
Inquiries: Kristiina Nieminen 029 551 2957, Hannele Markkanen 029 551 3358, khi@stat.fi
Head of Department in charge: Hannele Orjala
Updated 19.2.2021
Official Statistics of Finland (OSF):
Consumer price index [e-publication].
ISSN=1799-0254. January 2021,
Restrictive measures to prevent the spread of the coronavirus are visible in the data collection and weight structure of the Consumer Price Index in 2021
. Helsinki: Statistics Finland [referred: 6.2.2026].
Access method: http://stat.fi/til/khi/2021/01/khi_2021_01_2021-02-19_kat_001_en.html

