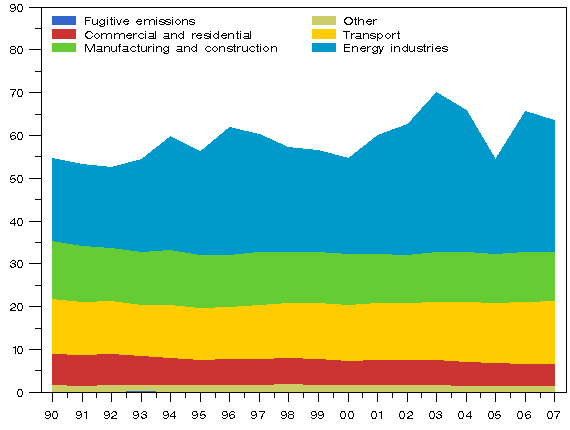
Figure 3: Development of emissions in the energy sector in 1990 - 2007 (million t CO2 eq.)

Source: Greenhouse gas inventory unit, Statistics Finland
Inquiries: Riitta Pipatti (09) 1734 3543, Tuija Lapveteläinen (09) 1734 3528, kasvihuonekaasut@stat.fi
Director in charge: Leena Storgårds
Updated 24.04.2009
Official Statistics of Finland (OSF):
Greenhouse gases [e-publication].
ISSN=1797-6065. 2007,
Figure 3: Development of emissions in the energy sector in 1990 - 2007 (million t CO2 eq.)
. Helsinki: Statistics Finland [referred: 8.2.2026].
Access method: http://stat.fi/til/khki/2007/khki_2007_2009-04-24_kuv_003_en.html

