Published: 26 April 2012
Preliminary data on greenhouse gas emissions in 2011
Corrected on 29 June 2012. The corrections are
indicated in red.
Besides official data on greenhouse gas emissions in 2010,
Statistics Finland now releases for the first time preliminary
emission figures by sector for 2011 broken down to emissions within
the emissions trading scheme and emissions outside it. In addition,
Statistics Finland has estimated for 2010 regional data by
municipality according to place of origin on the emissions of the
sectors not included in the emissions trading scheme.
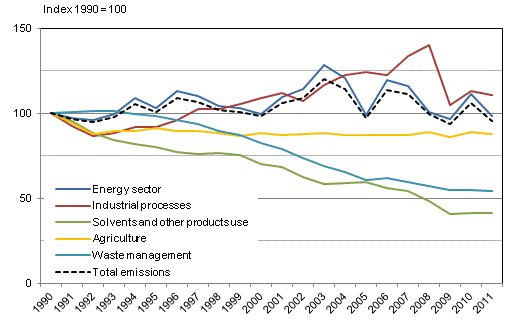
Total greenhouse gas emissions in 2010 amounted to 74.6 million tonnes of carbon dioxide equivalent (t CO2 eq.). According to preliminary data, total emissions in 2011 decreased by some 10 per cent (7 million t CO2 eq.) from 2010. The energy sector's emissions decreased by around 12 per cent. This was mainly due to reduced consumption of coal and natural gas and increased net imports of electricity.
Development of greenhouse gas emissions by sector in Finland 1990-2011. Data for 2011 are preliminary

In 2011, emissions under the emissions trading scheme decreased by approximately 15 per cent from the previous year. In sectors outside the emissions trading scheme (e.g. heating of buildings, transport, agriculture and waste management) the reduction in emissions only amounted to a couple of per cent.
The monitoring under the Effort Sharing Decision of the EU's Climate and Energy Package will in future require emissions data to be broken down to emissions within and outside the emissions trading scheme. The Effort Sharing Decision sets binding targets for emission reductions from the 2005 levels in the non-emissions trading scheme sectors during 2013-2020. The reduction target for Finland is 16 per cent by 2020. Between 2013 and 2020 the emissions must be on the so-called target path or below it. The path is linear and its starting point is the average of emissions from non-emissions trading scheme sources in 2008-2010 and its final point is the target for emissions reduction by 2020. Emissions from non-emissions trading scheme sources are calculated as the difference between reviewed total emissions and verified emissions of the emissions trading scheme sector. The data on the verified emissions of the emissions trading scheme sector are published by the Energy Market Authority.
Greenhouse gas emissions and removals broken down between emissions trading scheme sources and non-emissions trading scheme sources in 2005 and 2008-2011 (million t CO2 eq.). The land use, land-use change and forestry sector does no come under the scope of the emissions trading scheme or the reduction targets of effort sharing
| Corrected on 29 June 2012. Total emission data on emissions within the emissions trading scheme and those outside the emissions trading scheme have been corrected. The previously presented emission data were erroneously derived directly from the inventory calculation, which have now been corrected according to the data in the emissions trading registry. There were errors in the data on emissions within the emissions trading scheme for the years 2005, 2008, 2009 and 2010 as follows: 0.1, 0.1, 0.02 and 0.2. Correspondingly, the data on emissions outside the emissions trading scheme were too low by the amount of the mentioned errors. | |||||||
| 2005 | 2008 | 2009 | 2010 | 2011 1) | Change, 2010 - 2011 1) | ||
| Total excluding land use, land-use change and forestry sector | 68.6 | 70.2 | 66.1 | 74.6 | 67.3 | -7.3 | |
| Emissions trading 2) | 33.1 | 36.2 | 34.4 | 41.3 | 35.1 | -6.2 | |
| Non-emissions trading | 35.5 | 34.1 | 31.8 | 33.3 | 32.2 | -1.0 | |
| Land use, land-use change and forestry sector | -28.6 | -26.6 | -36.1 | -22.1 | -20.6 | 1.5 | |
2) Figures from Energy Market Authority
Greenhouse gas emissions and removals by sector broken down between emissions trading scheme sources and non-emissions trading scheme sources in 2005 and 2008-2011 (million t CO2 eq.). Data concerning 2010 were used for the sub-sectors for which no preliminary data were available for 2011. In these cases, changes in emissions were given as zero (0). Notation 0.0 means that the value of the quantity is less than 0.05. The land use, land-use change and forestry sector does no come under the scope of the emissions trading scheme or the reduction targets of effort sharing
| Corrected on 29 June 2012. Total emission data on emissions within the emissions trading scheme and on those outside the emissions trading scheme and emission data specified by sector have been corrected. The error in total emission data was presented above. The methodological calculation error concerning the emission data in the energy sector was corrected to the emission data specified by sector and a missing sub-category was added to combine the data of the emissions trading registry and the inventory. There were errors in emissions within the emissions trading scheme in the energy sector for the years 2005, 2008, 2009 and 2010 as follows: 0.2, 0.2, 0.2 and 0.2. Correspondingly, the data on emissions outside the emissions trading scheme in the energy sector were too low by the amount of the mentioned errors. In addition, emission data are now given at the accuracy of one decimal instead of two as before. | |||||||
| 2005 | 2008 | 2009 | 2010 | 2011 1) | Change, 2010 - 2011 | ||
| Emissions without land use, land-use change and forestry | 68.6 | 70.2 | 66.1 | 74.6 | 67.3 | -7.2 | |
| ETS sector 2) | 33.1 | 36.2 | 34.4 | 41.3 | 35.1 | -6.2 | |
| Energy | 29.5 | 31.8 | 30.8 | 37.3 | 31.2 | -6.1 | |
| Industrial processes | 3.6 | 4.3 | 3.4 | 4.0 | 3.9 | -0.1 | |
| Mineral products | 1.1 | 1.2 | 0.8 | 1.0 | 1.1 | 0.1 | |
| Chemical industry | 0.1 | 0.6 | 0.6 | 0.6 | 0.6 | -0.1 | |
| Metal production | 2.4 | 2.5 | 1.9 | 2.4 | 2.3 | -0.1 | |
| Difference between the emissions trading registry and the inventory 3) | 0.1 | 0.1 | 0.2 | 0.0 | |||
| Non-ETS sector | 35.5 | 34.1 | 31.8 | 33.3 | 32.2 | -1.0 | |
| Energy | 24.5 | 23.1 | 22.0 | 23.4 | 22.5 | -0.9 | |
| Energy without transport | 10.8 | 9.5 | 9.0 | 9.8 | 9.3 | -0.5 | |
| Transport | 13.7 | 13.6 | 13.0 | 13.6 | 13.2 | -0.4 | |
| Industrial processes | 2.8 | 2.9 | 1.9 | 1.7 | 1.7 | -0.0 | |
| Mineral products | 0.1 | 0.1 | 0.1 | 0.2 | 0.2 | 0.0 | |
| Chemical industry | 1.7 | 1.7 | 0.9 | 0.3 | 0.3 | -0.0 | |
| Metal production | 0.0 | 0.0 | 0.0 | 0.0 | 0.0 | 0 | |
| Consumption of F-gases | 0.9 | 1.0 | 0.9 | 1.2 | 1.2 | 0 | |
| Solvents and other products use | 0.1 | 0.1 | 0.1 | 0.1 | 0.1 | 0 | |
| Agriculture | 5.8 | 5.9 | 5.7 | 5.9 | 5.8 | -0.1 | |
| Enteric fermentation | 1.6 | 1.6 | 1.6 | 1.6 | 1.6 | 0.0 | |
| Manure management | 0.7 | 0.7 | 0.7 | 0.7 | 0.7 | 0.0 | |
| Agricultural soils | 3.5 | 3.6 | 3.4 | 3.5 | 3.5 | -0.1 | |
| Waste management | 2.4 | 2.3 | 2.2 | 2.2 | 2.2 | -0.0 | |
| Solid waste disposal on land | 2.0 | 1.9 | 1.8 | 1.8 | 1.8 | 0.0 | |
| Wastewater handling | 0.2 | 0.2 | 0.2 | 0.2 | 0.2 | 0 | |
| Composting | 0.1 | 0.1 | 0.1 | 0.1 | 0.1 | 0.0 | |
| Difference between the emissions trading registry and the inventory 3) | -0.1 | -0.1 | -0.2 | -0.0 | |||
| Land use, land-use change and forestry | -28.6 | -26.6 | -36.1 | -22.1 | -20.6 | 1.5 | |
| Forest land | -38.6 | -37.2 | -48.2 | -32.8 | -31.2 | 1.5 | |
| Cropland | 6.1 | 5.9 | 5.8 | 5.8 | 5.8 | 0 | |
| Grassland | 0.7 | 0.7 | 0.7 | 0.7 | 0.7 | 0 | |
| Wetlands | 1.6 | 1.9 | 2.0 | 2.1 | 2.1 | 0 | |
| Settlements | 1.9 | 1.8 | 1.8 | 1.8 | 1.8 | 0 | |
| Harvested wood products | -0.3 | 0.3 | 1.8 | 0.4 | 0.4 | 0 | |
2) Figures from Energy Market Authority
3) The divergence caused by the methodological and definitional differences in total emissions in the emissions trading sector between the data of the Energy.
The preliminary data on emissions in 2011 have been not been calculated at very detailed level and will become revised in the emission calculations that will be submitted to the Secretariat of the UNFCCC by 15 April 2013. Further information in Finnish about preliminary data on emissions and their calculation methods can be found in Statistics Finland's report Suomen kasvihuonekaasupäästöt vuosina 1990-2010.
Regional data on emissions
Interest in regional emissions data has increased recently as municipalities and regions have begun to draw up their own climate strategies. Regional decision-making and political actions have an impact especially on emissions from non-emissions trading scheme sources (e.g. heating of buildings, transport, and waste management). Regional data on emissions support the planning and monitoring of climate policy at the regional level.
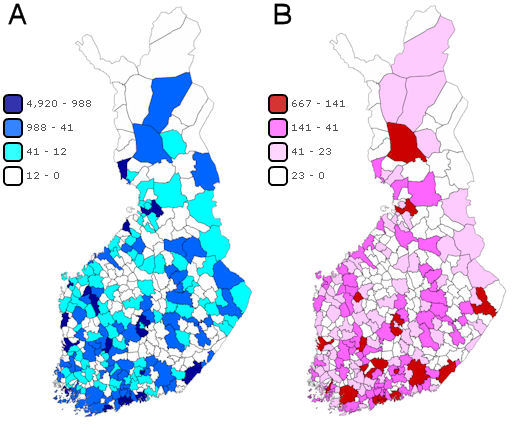
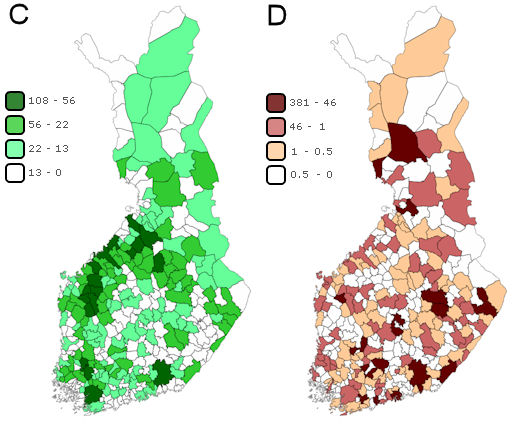
Statistics Finland's calculations have been performed from the so-called production-based perspective, i.e. emissions have been allocated to their areas of origin. The data have been calculated with methods consistent with the greenhouse gas inventory by allocating emissions to regions on the basis of data on the activities by municipality. The data have been separately calculated for the sectors of energy, transport, industrial processes (incl. solvent and other product use), agriculture and waste. The calculations exclude the land use, land-use change and forestry sector. Statistics Finland only publishes numeric data by municipality on emissions from the non-emissions trading scheme sectors. The data can be found in database tables . Respective data for the emissions trading scheme sector are not released for confidentiality reasons.The calculation method for regional data on emissions is still being developed further.
A) Greenhouse gas emissions from the energy sector and industrial processes by municipality in 2010 (1,000 t CO2 eq.), B) Greenhouse gas emissions from transport by municipality in 2010 (1,000 t CO2 eq.)

C) Greenhouse gas emissions from agriculture by municipality in 2010 (1,000 t CO2 eq.), D) Greenhouse gas emissions from the waste sector by municipality in 2010 (1,000 t CO2 eq.)

Source: Greenhouse gas inventory unit, Statistics Finland
Inquiries: Pia Forsell +358 9 1734 2937, Tuija Lapveteläinen +358 9 1734 3528, kasvihuonekaasut@stat.fi
Director in charge: Leena Storgårds
Publication in pdf-format (553.5 kB)
- Tables
-
Tables in databases
Pick the data you need into tables, view the data as graphs, or download the data for your use.
Appendix tables
- Appendix table 1. Finland's greenhouse gas emissions without LULUCF sector 1990 - 2010 (26.4.2012)
- Appendix table 2. Emissions and removals of the LULUCF sector in Finland 1990 - 2010 (26.4.2012)
- Appendix table 3. Carbon dioxide emissions in Finland 1990 - 2010 (26.4.2012)
- Appendix table 4. Methane emissions in Finland 1990 - 2010 (26.4.2012)
- Appendix table 5. Nitrous oxide emissions in Finland 1990 - 2010 (26.4.2012)
- Appendix table 6. Emissions of F-gases in Finland 1990 - 2010 (26.4.2012)
- Figures
-
- Appendix figure 1: Greenhouse gas emissions in Finland by sectors in 2010 (26.4.2012)
- Appendix figure 2: Greenhouse gas emissions in Finland in 1990 - 2010 (26.4.2012)
- Appendix figure 3: Development of emissions in Finland in the energy sector in 1990 - 2010 (26.4.2012)
- Appendix figure 4: Greenhouse gas emission in Finland in 1990 - 2011 in relation to the Kyoto target level. Data for 2011 are preliminary. (26.4.2012)
Updated 29.6.2012
Official Statistics of Finland (OSF):
Greenhouse gases [e-publication].
ISSN=1797-6065. 2010. Helsinki: Statistics Finland [referred: 19.2.2026].
Access method: http://stat.fi/til/khki/2010/khki_2010_2012-04-26_tie_001_en.html

