Published: 15 April 2014
Finland's greenhouse gas emissions in the Kyoto Protocol's first commitment period evaluated
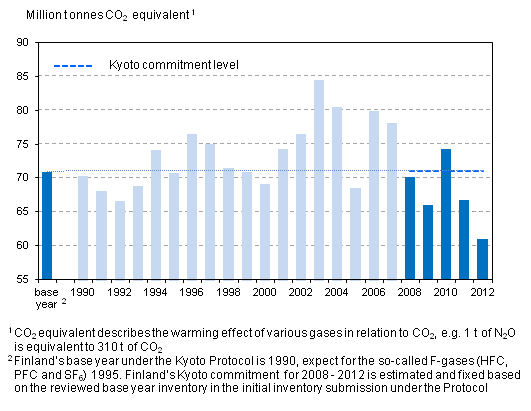
According to Statistics Finland's greenhouse gas emission data, Finland fulfils its emission reduction commitment for the Kyoto Protocol's first commitment period. The emissions for the period 2008 to 2012 were five per cent below the assigned amount of emissions specified for Finland. The change caused by the review calculation compared to the preliminary data released in December 2013 was quite minor (0.01 per cent over the period 2008 to 2012).
Commitment level of the Kyoto Protocol and Finland's greenhouse gas emissions in 1990 to 2012 (million tonnes of CO2 eq.), does not include LULUCF sector

Finland's greenhouse gas emissions in 2012 fell from the previous year by 5.9 million tonnes of carbon dioxide (CO2 equivalent) and corresponded to 61.0 million tonnes of carbon dioxide. The emissions decreased in all sectors compared to the previous year; the largest drop was seen in the energy sector, ten per cent (5.5 million tonnes of carbon dioxide). Fossil fuels and peat in the production of electricity were replaced with electricity imports, wood and domestic hydro power. The use of fossil fuels and peat also decreased clearly in manufacturing. A majority of the emission decrease materialised in emissions trading.
Net sink in the Land Use, Land-Use Change and Forestry sector (LULUCF) remained at the previous year's level, being 25.9 million tonnes of carbon dioxide.
Greenhouse gas emissions in Finland by sector. Emissions as amounts corresponding to million tonnes of carbon dioxide. Negative figures indicate removal of greenhouse gases from the atmosphere
| 1990 | 1995 | 2000 | 2005 | 2006 | 2007 | 2008 | 2009 | 2010 | 2011 | 2012 | |||
| Emissions excl. LULUCF sector | 70.3 | 70.8 | 69.2 | 68.6 | 79.9 | 78.2 | 70.1 | 66.0 | 74.4 | 66.9 | 61.0 | ||
| Energy sector | 54.5 | 56.0 | 54.4 | 54.0 | 65.3 | 63.2 | 54.7 | 52.7 | 60.5 | 53.3 | 47.8 | ||
| Energy industries | 19.2 | 24.1 | 22.1 | 21.9 | 32.9 | 30.8 | 24.2 | 25.2 | 30.6 | 24.7 | 20.7 | ||
| Manufacturing industries and construction | 13.4 | 12.1 | 11.9 | 11.3 | 11.6 | 11.4 | 10.7 | 8.4 | 9.9 | 9.6 | 8.4 | ||
| Transport | 12.8 | 12.0 | 12.8 | 13.7 | 13.9 | 14.2 | 13.6 | 12.9 | 13.4 | 13.2 | 12.7 | ||
| Other energy 1) | 9.2 | 7.8 | 7.6 | 7.0 | 6.9 | 6.7 | 6.2 | 6.2 | 6.6 | 5.7 | 6.1 | ||
| Industrial processes | 5.1 | 4.7 | 5.6 | 6.4 | 6.3 | 6.8 | 7.2 | 5.4 | 5.8 | 5.6 | 5.3 | ||
| Industrial processes (excl. F-gases) | 5.0 | 4.6 | 5.0 | 5.4 | 5.5 | 5.9 | 6.1 | 4.4 | 4.6 | 4.5 | 4.3 | ||
| Consumption of F-gases | 0.1 | 0.1 | 0.6 | 0.9 | 0.8 | 1.0 | 1.1 | 0.9 | 1.2 | 1.1 | 1.0 | ||
| Solvents and other products use | 0.2 | 0.1 | 0.1 | 0.1 | 0.1 | 0.1 | 0.1 | 0.1 | 0.1 | 0.1 | 0.1 | ||
| Agriculture | 6.5 | 6.0 | 5.8 | 5.7 | 5.7 | 5.8 | 5.8 | 5.7 | 5.9 | 5.8 | 5.7 | ||
| Waste management | 4.0 | 3.9 | 3.3 | 2.4 | 2.5 | 2.4 | 2.3 | 2.2 | 2.2 | 2.1 | 2.1 | ||
| LLULUCF sector | -13.7 | -12.8 | -19.2 | -28.6 | -32.5 | -24.3 | -29.0 | -38.8 | -24.1 | -24.1 | -25.9 | ||
Emissions from non-emissions trading scheme sources are calculated as the difference between the reviewed total emissions and verified emissions of the emissions trading scheme sector. The data on the verified emissions of the emissions trading scheme sector are published by the Energy Authority.
Greenhouse gas emissions and removals broken down between emissions trading scheme sources and non-emissions trading scheme sources in 2005 and 2008 to 2012 (million tonnes CO2 eq.). Negative figures indicate removal of greenhouse gases from the atmosphere
| 2005 | 2008 | 2009 | 2010 | 2011 | 2012 | Change, 2011–2012 | ||
| Total excl. LULUCF sector | 68.6 | 70.1 | 66.0 | 74.4 | 66.9 | 61.0 | -5.9 | |
| Emissions trading sector 1) | 33.1 | 36.2 | 34.4 | 41.3 | 35.1 | 29.5 | -5.6 | |
| Non-emissions trading sector 2) | 35.5 | 34.0 | 31.6 | 33.1 | 31.8 | 31.5 | -0.3 | |
| LULUCF sector 3) | -28.6 | -29.0 | -38.8 | -24.1 | -24.1 | -25.9 | -1.7 | |
2) Also includes the emissions of domestic civil aviation, although the emissions in question are in the emissions trading scheme of the EU's internal civil aviation
3) The LULUCF sector does not come under the scope of the emissions trading scheme
Source: Greenhouse gas inventory unit, Statistics Finland
Inquiries: Pia Forsell 09 1734 2937, Riitta Pipatti 09 1734 3543, kasvihuonekaasut@stat.fi
Director in charge: Leena Storgårds
Publication in pdf-format (283.8 kB)
- Tables
-
Tables in databases
Pick the data you need into tables, view the data as graphs, or download the data for your use.
- Figures
- Revisions in these statistics
-
- Revisions in these statistics (15.4.2014)
Updated 15.4.2014
Official Statistics of Finland (OSF):
Greenhouse gases [e-publication].
ISSN=1797-6065. 2012. Helsinki: Statistics Finland [referred: 8.2.2026].
Access method: http://stat.fi/til/khki/2012/khki_2012_2014-04-15_tie_001_en.html

