Published: 17 March 2022
Discontinuation of education increased in upper secondary level particularly in vocational education and decreased in tertiary level education in 2020
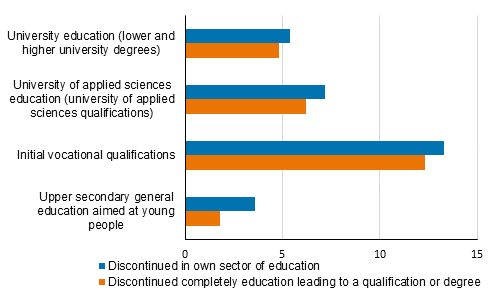
In all, 6.8 per cent of students attending education leading to a qualification or a degree discontinued their studies and did not resume them in education leading to a qualification or degree in the academic year 2019/2020. Discontinuation of education in initial vocational education grew by 3.9 percentage points from the previous year. In initial vocational education the discontinuation percentage was 13.3, in general upper secondary education aimed at young people it was 3.6, in university of applied sciences education (university of applied sciences degrees) 7.2 and in university education (Bachelor's and Master's degrees) 5.4 per cent. These data derive from Statistics Finland’s Education Statistics.
Discontinuation of education leading to a qualification or degree 2919/2020, %

The corona pandemic that started in late winter 2020 probably increased discontinuation in upper secondary education. In addition to initial vocational education, discontinuation of studies also increased in general upper secondary education aimed at young people in the academic year 2019/2020, but only by 0.6 percentage points, or clearly less than in vocational education. Discontinuation of tertiary level studies decreased from the previous year; in university of applied sciences education (university of applied sciences degrees) by 0.3 percentage points and in university education (Bachelor's and Master's degrees) by 0.4 percentage points.
Discontinuation of tertiary level education decreased particularly among men
Men discontinued their education leading to a qualification or degree more often than women. Altogether 8.0 per cent of men and 5.8 per cent of women discontinued education completely in the academic year 2019/2020. Women changed their sector of education slightly more than men did. Both men and women discontinued vocational education most often, women more than men. Among students in vocational education, men discontinued education leading to a qualification completely more often than women.
Discontinuation decreased from the previous academic year in university of applied sciences and university education for both men and women, in university of applied sciences education by 0.5 percentage points for men and by 0.1 percentage points for women, in university education by 0.6 percentage points for men and by 0.3 percentage points for women.
Discontinuation of education leading to a qualification or degree by sex and sector of education in academic year 2019/2020 1)
| Sex / sector of education | Number of students used in the statistics on discontinuation of education 20 Sept. 2019 | Discontinued in own sector of education | Changed sector of education | Discontinued completely education leading to a qualification or degree | |
| Pieces | % | % | % | ||
| Total | 501 149 | 7,8 | 1,0 | 6,8 | |
| Men and women | Upper secondary general education (aimed at young people) | 96 389 | 3,6 | 1,7 | 1,8 |
| Initial vocational qualifications | 151 051 | 13,3 | 1,1 | 12,3 | |
| University of applied sciences education (university of applied sciences degrees) | 119 262 | 7,2 | 0,9 | 6,2 | |
| University education (Bachelor’s and Master’s degrees) | 134 447 | 5,4 | 0,6 | 4,8 | |
| Men | Total | 236 867 | 8,9 | 0,9 | 8,0 |
| Upper secondary general education (aimed at young people) | 39 941 | 3,9 | 1,6 | 2,2 | |
| Initial vocational qualifications | 78 215 | 13,3 | 0,8 | 12,5 | |
| University of applied sciences education (university of applied sciences degrees) | 57 573 | 9,2 | 1,0 | 8,2 | |
| University education (Bachelor’s and Master’s degrees) | 61 138 | 6,2 | 0,6 | 5,6 | |
| Women | Total | 264 282 | 6,9 | 1,1 | 5,8 |
| Upper secondary general education (aimed at young people) | 56 448 | 3,3 | 1,8 | 1,5 | |
| Initial vocational qualifications | 72 836 | 13,4 | 1,4 | 12,0 | |
| University of applied sciences education (university of applied sciences degrees) | 61 689 | 5,3 | 0,9 | 4,3 | |
| University education (Bachelor’s and Master’s degrees) | 73 309 | 4,6 | 0,6 | 4,1 | |
Large differences in fields of education by sector of education
In the academic year 2019/2020, the highest total discontinuation rate was recorded for all sectors of education in services (17.2 per cent) and in agriculture and forestry (15.2 per cent) and the lowest in general education (3.6 per cent). Discontinuation in various sectors of education focuses on different fields of education.
In initial vocational education, discontinuation was most common in the field of natural sciences (21.5 per cent) and services (20.5 per cent), and least in the field of business, administration and law (14.4 per cent).
Discontinuation in university of applied sciences education was most common in ICT (11.3 per cent) and agriculture and forestry (10.0 per cent). Discontinuation in university education was biggest in natural sciences (11.2 per cent) and ICT (10.9 per cent). Discontinuation in both university of applied sciences education and university education was lowest in health and welfare, in university of applied sciences education 4.7 per cent and in university education 2.5 per cent.
New information about discontinuation of education by sex and field of education
The statistics on discontinuation of education now contain data for the first time on discontinuation of education in different fields of education by sex.
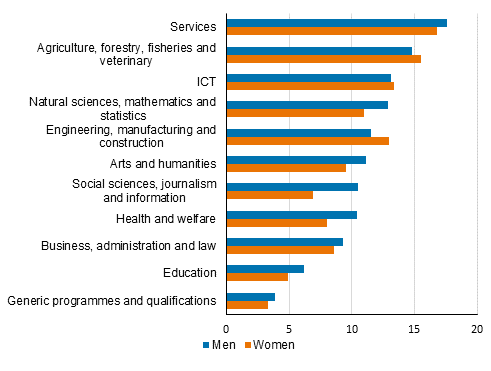
Both men and women discontinued education most in services, men 17.6 per cent and women 16.8 per cent, and least in general education, that is, general upper secondary education, in the academic year 2019/2020.
Discontinuation of education leading to a qualification or degree by field of education and sex in academic year 2019/2020

Discontinuation was biggest in fields of education strongly segregated by sex, especially in initial vocational education. In initial vocational education, men discontinued studies clearly more often in the field of health and welfare (19.1 per cent) than women (13.6 per cent), and correspondingly, women discontinued studies in the male-dominated ICT sector (31.2 per cent) clearly more often than men (17.2 per cent). In the field of technology, which is the biggest field of education measured by the number of students in initial vocational education, women's discontinuation percentage was also higher, 20.8 per cent, than men's, 14.4 per cent. In services, which is also a large field in vocational education, both sexes discontinued equally much.
In university of applied sciences education (university of applied sciences degrees), men discontinued studies more often than women in all fields of education. Discontinuation of education was lowest for men in education (6.8 per cent) and for women in the fields of health and welfare (4.2 per cent). Both men's and women's discontinuation was high in ICT, 11.8 per cent for men and 9.6 per cent for women.
In university education, men discontinued in nearly every field of education more often than women. Both men and women discontinued most in the field of natural sciences, 12.4 per cent for men and 10.1 per cent for women. Men discontinued (11.1 per cent) more often than women (10.0 per cent) in male-dominated ICT, but women discontinued considerably more than average in all fields of education (6.4 per cent). In female-dominated fields of education both sexes discontinued a little, for women 5.0 per cent and for men 6.0 per cent, similarly as in health and welfare, for women 2.4 per cent and for men 2.6 per cent.
The statistics on discontinuation of education use the National Classification of Education 2016 in examining discontinuation. The discontinuation figures were calculated to levels 1 and 2 of the National Classification of Education. Data by sex have been added to the database tables by field of education.
The database tables of the statistics contain information on discontinuation of studies by sector of education in different fields of education and regions. There is a new table on discontinuation of education by age of students.
Calculation of discontinuation of education
These statistics describe the discontinuation of post-comprehensive school education leading to a qualification. Data concerning discontinuation in the academic year 2019/2020 have been obtained by examining the situation in September 2020 of the students who attended education in September 2019. If a person has not obtained a qualification or continued education during this period, he/she is counted as having discontinued education. To monitor discontinuation of education, students have been followed in a certain logical order, in which the completion of the examination has been prioritised before continuing studies. The calculation of discontinuation and the definition of the population are explained in the quality description (in Finnish).
More information related to the progress of studies is available from statistics describing Progress of studies and Employment of students.
Source: Education. Statistics Finland
Inquiries: Heli Hiltunen 029 551 3314, koulutustilastot@stat.fi
Head of Department in charge: Hannele Orjala
Publication in pdf-format (219.1 kB)
- Tables
-
Tables in databases
Pick the data you need into tables, view the data as graphs, or download the data for your use.
Updated 17.3.2022
Official Statistics of Finland (OSF):
Discontinuation of education [e-publication].
ISSN=1798-9302. 2020. Helsinki: Statistics Finland [referred: 18.2.2026].
Access method: http://stat.fi/til/kkesk/2020/kkesk_2020_2022-03-17_tie_001_en.html

