Published: 13 October 2017
Employment in cultural industries and occupations weakened from the year before
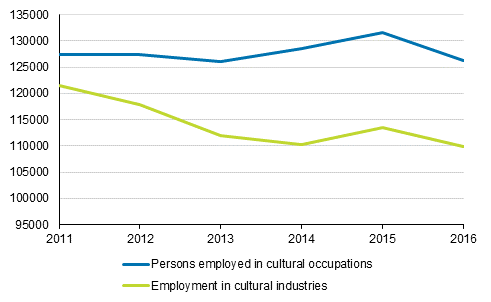
Employment in cultural industries weakened by around three per cent from 2015 to 2016 and was around 110,000. Employment weakened most in publishing activities. The employment of those working in cultural occupations as their main job also weakened from the previous year by around four per cent and over 126,000 were employed in cultural occupations in 2016.
Employment in cultural industries and occupations in 2011 to 2016

Source: Statistics Finland: Labour Force Survey
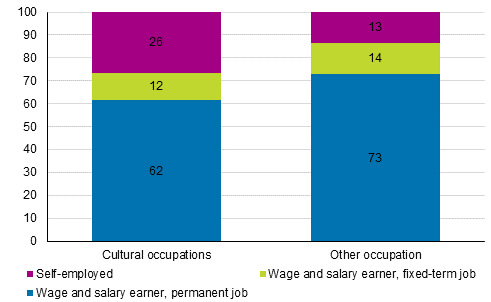
A considerably large share of those working in cultural occupations were self-employed. Seventy-four per cent were working as wage and salary earners and 26 per cent were self-employed, while the corresponding shares of those working in other occupations were 87 and 12 per cent. Of big occupational groups, around one-third of journalists, authors and architects were self-employed.
More information about the shares of self-employed persons in different occupations is available from employment statistics, which describe the employment of the entire population at the end of the year and are based on a number of register data. According to employment statistics, the share of self-employed persons was high for photographers, interior designers and decorators, visual artists, directors and producers, as well as musical instrument makers, jewellery and precious-metal workers, potters and related workers, and glass makers, cutters, grinders and finishers ( (Employed labour force in cultural occupations by employer sector, in finnish) .
Only 62 per cent of those employed in cultural occupations have a permanent employment relationship, while the corresponding share for those working in other occupations is 73 per cent. The difference is explained by the large share of self-employed persons. Twelve per cent of those employed in cultural occupations worked in fixed-term positions and the remainder were self-employed.
Permanency of employment relationship in cultural and other occupations in 2016, %

Twenty-one per cent of those in cultural occupations had a part-time job while in other occupations just 16 per cent worked part time.
The work of those employed in cultural occupations is often project-type short-term jobs and several simultaneous jobs are also common. Around nine per cent of those in cultural occupations had more than one job and about six per cent of those working in other occupations in 2016.
The average weekly working hours of those working in cultural occupations as their main job was slightly shorter than among those in other occupations. It was 34 hours in cultural occupations and nearly 36 hours in other occupations.
In both cultural occupations and industries, the number of men and women on the total level was almost equal. Male-dominated occupations included sales and marketing managers, broadcasting and audio-visual technicians, musical instrument makers, glass-makers, cutters, grinders and finishers, glass-engravers and etchers, printers, print finishing and binding workers.
Female-dominated occupations were filing and copying clerks, library clerks, interior designers and decorators, dancers and choreographers, and crafts and art teachers (Employed labour force in cultural occupations by gender) .
Among industries, printing of newspapers and other papers was dominated by men, while translation and interpretation was a female-dominated industry.
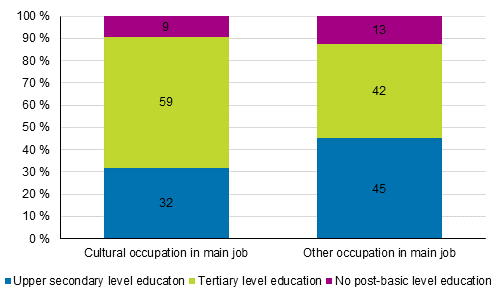
Cultural professionals are highly educated. Nearly 60 per cent of those working in cultural occupations had tertiary level education, while the share was only 42 per cent in other occupations. Thirty-one per cent of those employed in cultural occupations had upper secondary level education. Nine per cent had not acquired post-basic level education (Figure 3).
These data derive from Statistics Finland’s Labour Force Survey and the Employmentstatistics.
Level of education distribution of those working in cultural and other occupations as their main job in 2016, %

Labour force and unemployment rate of those with qualifications in the field of culture
The labour force with qualifications in the field of culture has more than doubled from 2000 and was 84,167 in 2015. The activity rate of those with qualifications in the field of culture among the whole labour force with qualifications has also grown from 2.1 to 3.7 per cent from 2000 to 2015.
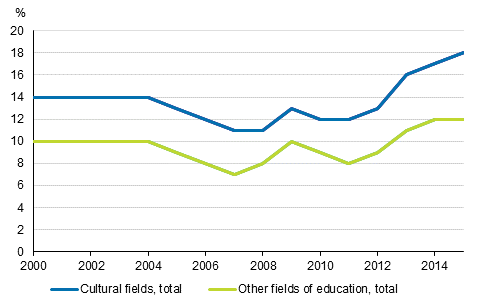
The unemployment rate of those with qualifications in the field of culture has long been higher than the average unemployment rate of other fields of education (Cultural statistics table service, Table 11.6) .
Unemployment rate in the field of culture and other fields of education in 2000 to 2015

Source: Statistics Finland, Population Statistics: Education
In 2016, the number of unemployed jobseekers in arts occupations was 8,412, whereas in 2000, they numbered just 3,214. Of all unemployed jobseekers 2.4 per cent were arts professionals. As many as 36 per cent of unemployed jobseekers in arts occupations were visual artists (Cultural statistics table service, Table 11.7) .
These data derive from Statistics Finland’s education statistics and the Employment Service Statistics of the Ministry of Economic Affairs and Employment.
Earnings in cultural occupational groups
In 2015, over 27,000 workers in certain cultural occupations were employed in the private sector. Almost one-half of them were women. In the private sector, the average regular monthly earnings of these cultural occupation groups were EUR 3,574, for men EUR 3,974 and for women EUR 3,151.
Advertising and public relations managers attained earnings of over EUR 6,000. The average earnings of men were EUR 6,552 and of women EUR 5,901. The earnings were lowest, EUR 2,280 among interior designers and decorators (Cultural statistics table service, Table 11.9) .
A total of 5,448 persons were working in the local government sector in certain cultural occupations in 2016. In the local government sector, the average regular monthly earnings were EUR 3,036, for men EUR 3,461 and for women EUR 2,928. Theatre directors earned most, EUR 5,144, on average. City architects also attained earnings of over EUR 5,000. Museum helpers’ earnings remained under EUR 2,000 as they earned EUR 1,981, on average (Cultural statistics table service, Table 11.8) .
Source: Cultural statistics 2016 Statistics Finland
Inquiries: Kaisa Weckström 029 551 2348, kulttuuri.tilastokeskus@stat.fi
Director in charge: Jari Tarkoma
Publication in pdf-format (193.9 kB)
- Tables
-
Tables in databases
Pick the data you need into tables, view the data as graphs, or download the data for your use.
Updated 13.10.2017
Official Statistics of Finland (OSF):
Culture [e-publication].
ISSN=2341-7404. Cultural Employment in Finland 2016. Helsinki: Statistics Finland [referred: 11.2.2026].
Access method: http://stat.fi/til/klt/2016/01/klt_2016_01_2017-10-13_tie_001_en.html

