Published: 19 October 2018
Owners of dwellings and housing companies renovated with EUR 6.2 billion in 2017
According to Statistics Finland, owners of dwellings and housing companies renovated their dwellings and residential buildings to the tune of EUR 6.2 billion in 2017. The combined renovation costs decreased by 6.2 per cent from the level of 2016 and they have grown by 8.1 per cent from 2013. EUR 2.9 billion were spent on renovating detached and semi-detached houses. EUR 2.5 billion were used on renovations to blocks of flats, and EUR 780 million to terraced houses.
Most of the renovations to blocks of flats, EUR 2.0 billion, were spent on renovations made by housing companies and the remaining EUR 530 million on own renovations or contracted renovations by owners of dwellings in blocks of flats. Terraced house companies used EUR 520 million on renovations and owners of dwellings in terraced houses EUR 260 million.
The figures include value added tax. Renovation costs do not include the value calculated for own work or voluntary work.
Renovation costs by type of house and structural element in 2017, EUR million
| Structural element | Type of house | |||||||
| Detached and semi-detached houses | Terraced houses | Blocks of flats | All 2017 | All 2016 | All 2015 | All 2014 | All 2013 | |
| Damp areas | 418 | 124 | 246 | 788 | 918 | 847 | 625 | 749 |
| Kitchen | 320 | 83 | 179 | 582 | 568 | 585 | 516 | 602 |
| Living and other areas | 343 | 58 | 105 | 506 | 657 | 664 | 654 | 883 |
| Outer surfaces and structures | 873 | 240 | 674 | 1 787 | 2 037 | 1 846 | 1 620 | 1 510 |
| Building technology | 591 | 177 | 1 024 | 1 791 | 1 762 | 1 518 | 1 645 | 1 496 |
| Yard area and outbuildings | 347 | 53 | 140 | 540 | 486 | 580 | 509 | 352 |
| Indoor areas of the housing company | 0 | 44 | 175 | 219 | 192 | 226 | 202 | 154 |
| Total | 2 891 | 780 | 2 543 | 6 213 | 6 622 | 6 266 | 5 771 | 5 745 |
Renovation costs relative to the floor area amounted to EUR 46.2 per m▓ in blocks of flats in 2017. The corresponding cost item was EUR 32.1 per m▓ in terraced houses and EUR 21.3 per m▓ in detached houses.
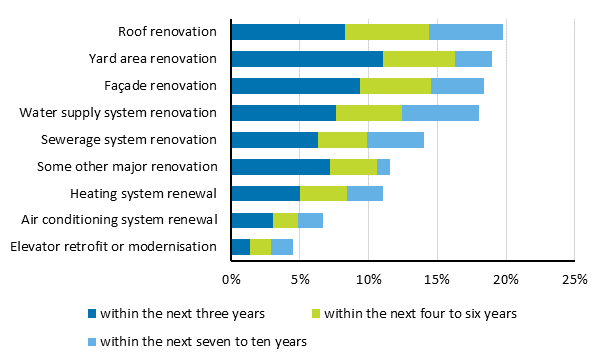
Housing companies were asked about large renovations that are planned for the next ten years. Almost 20 per cent of the housing companies that answered the question were planning a roof renovation. Nineteen per cent were planning a yard renovation. Eighteen per cent were planning a fašade renovation and as many a water supply system renovation and 14 per cent a sewerage system renovation.
Large renovations planned by housing companies, percentage of respondents

The renovation costs of state-subsidised rental dwelling companies amounted to EUR 475 million in 2017 and to EUR 450 million in 2016.
EUR 1.6 billion were used for renovating commercial and office buildings
According to Statistics Finland, EUR 1.0 billion were used on renovations to office buildings in 2017 and EUR 630 million on renovations to commercial buildings. Compared to the year before, renovation costs for commercial buildings decreased by 17 per cent and renovation costs for office buildings decreased by 12 per cent. In total, the renovations of commercial and office buildings went down by 14 per cent.
EUR 1.6 billion were used on renovations to service buildings and EUR 1.1 billion on industrial and warehouse buildings in 2017. The renovation costs of these groups of buildings were calculated based on the realised costs and granted renovation and expansion permits. For industrial and warehouse buildings the realised costs were studied by an inquiry in 2015 and estimated based on data on granted renovation and expansion permits for 2016 and 2017. Correspondingly, the renovation costs of service buildings were studied by an inquiry in 2016 and estimated based on data on granted renovation and expansion permits for 2017. According to the statistics, the renovation costs of industrial and warehouse buildings increased by 9.2 per cent and the renovation costs of service buildings decreased by 6.7 per cent.
Renovation costs of buildings by purpose of use of the building
| Year | Use of the building | |||
| Industrial buildings and warehouses | Commercial buildings | Office buildings | Public service buildings | |
| 2013 | . | . | . | 1 298 |
| 2014 | . | 669 | 910 | 1 223 1) |
| 2015 | 919 | 668 1) | 1 032 1) | 1 229 1) |
| 2016 | 1 030 1) | 756 1) | 1 140 1) | 1 739 |
| 2017 | 1 125 1) | 631 | 1 004 | 1 623 1) |
Source: Renovation of buildings and apartments. Statistics Finland
Inquiries: Eetu Toivanen 029 551 3331, Jose Lahtinen 029 551 3776, rakennus.suhdanne@stat.fi
Director in charge: Mari Ylń-Jarkko
Publication in pdf-format (242.4 kB)
- Tables
-
Tables in databases
Pick the data you need into tables, view the data as graphs, or download the data for your use.
Appendix tables
- Figures
Updated 19.10.2018
Official Statistics of Finland (OSF):
Renovation building [e-publication].
ISSN=1799-2974. Renovation of buildings and apartments 2017. Helsinki: Statistics Finland [referred: 15.2.2026].
Access method: http://stat.fi/til/kora/2017/01/kora_2017_01_2018-10-19_tie_001_en.html

