7. Number of children dying in fatal accidents has decreased
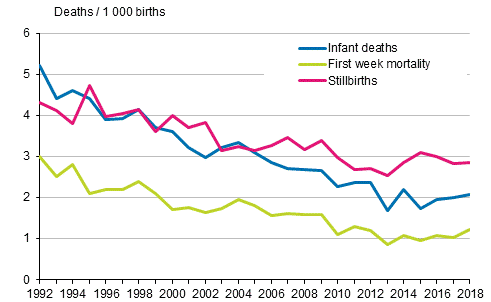
In 2018, altogether 99 children died under the age of one, while twenty years ago the figure was over 200. In 2018, the infant mortality was 2.1 per 1,000 live-born children (Figure 12). The main causes of death among children under the age of one were perinatal causes and congenital malformations (Table 4). By contrast, infectious diseases, accidents and violence were rare causes of death for infants.
There were 136 stillbirths in 2018. Stillbirths have decreased clearly from the 1990s (1998: 237). Perinatal mortality (deaths during the first week and stillborn) was 4.1 per thousand births. More than one-half of children dying during their first year of life die during their first week of life and three out of four in the neonatal period or during the first four weeks of life. The main causes of death after the neonatal period are cot deaths and congenital malformations. The number of cot deaths has decreased in the 2000s. In 2018, there were six cot deaths, while in 2000 the number was 18. Cot deaths mostly occur to children over the age of one month.
Over the past 20 years, the number of children dying at the age of one to fourteen has halved. In 2018, altogether 68 children died, which was clearly fewer than in the year before when 81 children died. This corresponds with approximately 10 deaths per 100,000 children. Fatal accidents, like traffic accidents and drownings, in particular, occur to children clearly less often than before. There were seven children aged one to fourteen that died in accidents, while 20 years ago the number was 37. The most common causes of death among children were cancers and congenital malformations.
In the past ten years, two to three women per year have died from reasons related to pregnancy or childbirth. In 2018, there were two maternal deaths, i.e. maternal mortality was 4.2 deaths per 100,000 live-born children.
More information about mortality during the infant and perinatal periods can be found in Appendix table 3.
Figure 12. Mortality during infant and perinatal period in 1992 to 2018

Table 4. Causes of death among children under the age of one 2000, 2005, 2010, 2017 and 2018
| 2000 | 2005 | 2010 | 2017 | 2018 | |
| Total deaths | 205 | 179 | 138 | 101 | 99 |
| Certain conditions originating in the perinatal period (P00-P96) | 84 | 77 | 58 | 47 | 46 |
| Congenital malformations and chromosomal abnormalities (Q00-Q99) | 78 | 61 | 40 | 30 | 23 |
| Sudden infant death syndrome (R95) | 18 | 19 | 17 | 5 | 6 |
| Diseases of circulatory system and respiratory system (J00-J99, I00-J99) | 4 | 5 | 5 | 1 | 3 |
| Endocrine, nutritional and metabolic diseases (E00-E90) | 5 | 6 | 3 | 7 | 8 |
| Other diseases and unknown | 13 | 9 | 11 | 9 | 12 |
| Accidents and assault (V01-Y89) | 3 | 2 | 4 | 2 | 1 |
Source: Causes of death, Statistics Finland
Inquiries: Kati Taskinen 029 551 3648, Airi Pajunen 029 551 3605, Jari Hellanto 029 551 3291, kuolemansyyt@stat.fi
Director in charge: Jari Tarkoma
Updated 16.12.2019
Official Statistics of Finland (OSF):
Causes of death [e-publication].
ISSN=1799-5078. 2018,
7. Number of children dying in fatal accidents has decreased
. Helsinki: Statistics Finland [referred: 21.2.2026].
Access method: http://stat.fi/til/ksyyt/2018/ksyyt_2018_2019-12-16_kat_007_en.html

