

Published: 15 August 2017
Output of the national economy made a downturn in June
Seasonally adjusted output fell by 1.5 per cent in June 2017 from the month before. Adjusted for working days, output was 0.5 per cent lower than one year before. According to revised data, working-day adjusted output rose in May by 2.8 per cent (previously 2.5 per cent) from May 2016.
Volume of total output 2005 to 2017, trend and seasonally adjusted series
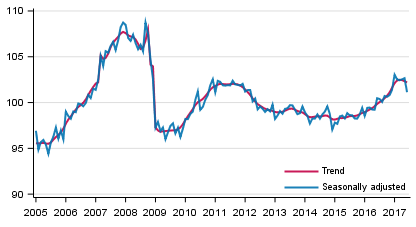
The series of the Trend Indicator of Output are seasonally adjusted with the Tramo/Seats method. The latest observations of the series adjusted for seasonal and random variation (seasonally adjusted and trend series) become revised with new observations in seasonal adjustment methods. Revisions especially at turning points of economic trends may be significant, which should be taken into consideration when using seasonally adjusted and trend data.
Working day adjusted change of total output from previous year’s corresponding month, %
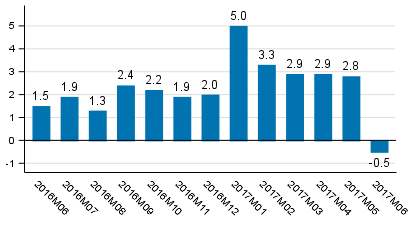
Adjusted for working days, primary production increased by three per cent and secondary production by nearly one per cent year-on-year. Services fell by one per cent from June 2016.
Primary production refers to agriculture, hunting, forestry and fishing. Secondary production includes manufacturing and construction. Services comprise trade, hotel and restaurant activities, transport and business activities, as well as real estate, renting and research services, financial intermediation and insurance, and public services.
Growth of GDP and employment from one year ago is estimated to have continued in the second quarter of 2017
Seasonally adjusted GDP is estimated to have fallen by 0.5 per cent from the previous quarter. According to the series adjusted for working days, GDP was 1.6 per cent up on the corresponding quarter of the year before. It is estimated that the number of the employed has increased by 0.9 per cent from the second quarter of 2016. Adjusted for working days, the number of hours worked was 0.7 per cent higher than in the same quarter of one year ago.
The data are based on preliminary data of the Trend Indicator of Output. The next quarterly national accounts with more detailed data will be published on 1 September 2017.
Flash estimate, seasonally adjusted, at reference year 2010 prices
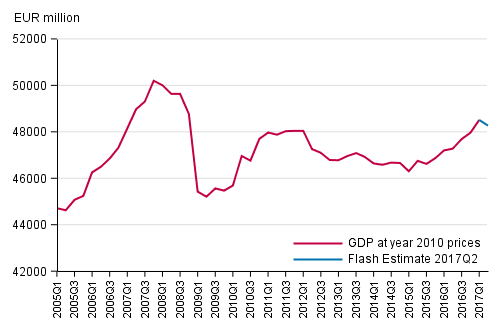
Intermediate consumption, as well as taxes and subsidies on products are not estimated in the compilation of the quarterly flash estimate, but quarterly GDP is carried forward with a change based on the data of the Trend Indicator of Output.
Source: Trend Indicator of Output 2017 June, Statistics Finland
Inquiries: Ida Peltonen 029 551 3334, Samu Hakala 029 551 3756, kansantalous.suhdanteet@stat.fi
Director in charge: Ville Vertanen
Publication in pdf-format (210.1 kB)
- Tables
-
Tables in databases
Pick the data you need into tables, view the data as graphs, or download the data for your use.
- Revisions in these statistics
-
- Revisions in these statistics (15.8.2017)
Updated 15.8.2017
Official Statistics of Finland (OSF):
Trend Indicator of Output [e-publication].
ISSN=1798-5439. June 2017. Helsinki: Statistics Finland [referred: 27.7.2026].
Access method: http://stat.fi/til/ktkk/2017/06/ktkk_2017_06_2017-08-15_tie_001_en.html