Published: 2 October 2018
Value of welfare services for households an average of good EUR 7,000 per year
In 2016, the monetary benefit gained by households from the use of welfare services was EUR 7,100, on average. Households got most value for their tax euros from free education, EUR 3,300, on average, and health care, nearly EUR 2,900 per household.
Nearly everybody benefits from welfare services in some form, close on three per cent of households did not use them at all during the year.
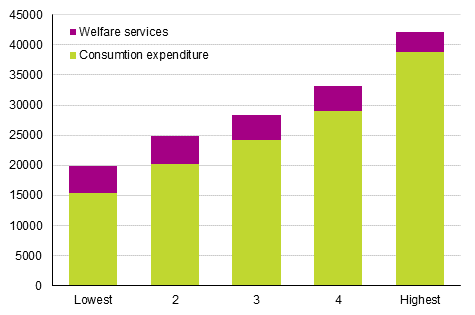
Households’ actual consumption expenditure by income bracket in 2016 (EUR per consumption unit)

The income distribution effect of welfare services can generally be thought to equalise income differences to some degree, for example, because low income earners get ill more. In Finland, services are utilised in euros relatively evenly in different income brackets, the highest income quintile somewhat less.
When the value of used welfare services is proportioned to the household’s other consumption expenditure, the differences become clearer. For low income earners, paying for the services themselves would add nearly one third to consumption expenditure. Expenditure would grow by 10 per cent in the highest income quintile. The average increase in consumption expenditure would be around 20 per cent.
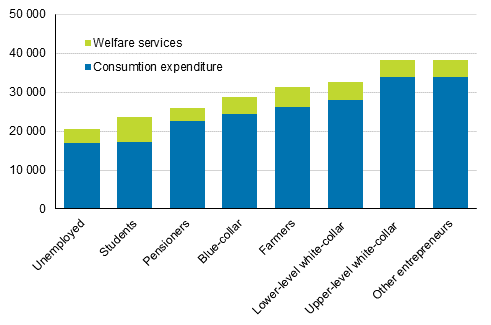
The income distribution effect is partly linked to the life situation. Student households typically belong to the lowest income brackets, but free education raises the so-called actual consumption expenditure, in which the consumption of public services is included, considerably higher. If student households had to pay for their studies themselves, it would mean at nearly a 50 per cent increase in consumption expenditure per year.
Households’ actual consumption expenditure by socio-economic group in 2016 (EUR per cosumption unit)

Households’ actual consumption – concept for international comparisons
In international consumption and income comparisons it is recommend to use the concepts of actual consumption and the corresponding adjusted income, where the monetary benefit gained from the use of public services is included. Comparison of mere consumption expenditure or monetary income can give a false image of the subsistence differences of households in different countries if account is not taken of the effect of free services or low-cost services in relation to production costs.
Around 40 percent of public consumption expenditure is spent on arranging public welfare services (education, health care, early childhood education and municipal home care services). The remainder is used on financing social security, administration and collective services, such as water and waste management, the road network, the police, the defence forces, rescue services and so on.
The monetary value of welfare services was calculated in a comparable manner for the first time for the data of the 2012 the Household Budget Survey. All the unit costs needed in the calculation were no longer available at all or at a corresponding accuracy level. In such cases, use was made of a less detailed level unit cost or the data for 2012 was inflated by the value of money in 2016 using an appropriate price index of public expenditure.
Source: Households' consumption 2016, Statistics Finland
Inquiries: Mira Kajantie 029 551 3626, Tuomas Parikka 029 551 3276
Director in charge: Jari Tarkoma
Publication in pdf-format (169.6 kB)
- Tables
-
Tables in databases
Pick the data you need into tables, view the data as graphs, or download the data for your use.
Updated 2.10.2018
Official Statistics of Finland (OSF):
Households' consumption [e-publication].
ISSN=2323-3028. 2016. Helsinki: Statistics Finland [referred: 21.2.2026].
Access method: http://stat.fi/til/ktutk/2016/ktutk_2016_2018-10-02_tie_001_en.html

