Party analysis - True Finns won the day
Compared to the preceding Municipal elections, the True Finns won 4.5 percentage points and took a total of 5.4 per cent of the votes cast.
Social Democrats and Centre Party lost the most
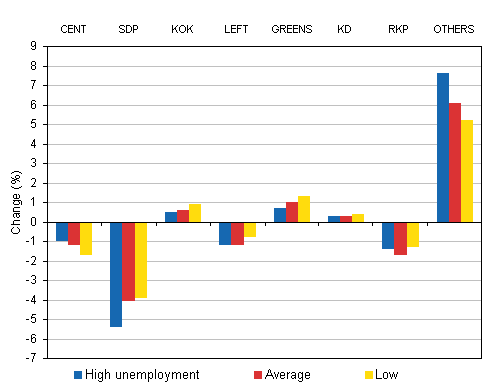
In the 2004 Municipal elections the True Finns took such a small share of the votes, namely 0.9 per cent, that the party is included in the aggregate class "Others" in Statistics Finland's analysis. The changes in this class, however, illustrate the background for the victory of the True Finns rather well. For instance, in Uusimaa the True Finns won the most in urban districts and in districts with unemployment and a low income level.
Changes in support for parties in Uusimaa in districts with different levels of unemployment

According to the election analysis produced by Statistics Finland, the Social Democratic Party and the Left Alliance lost support in the same kinds of districts where the True Finns won support. The Social Democrats in particular lost in districts where support for them has been strong, whereas the True Finns won in these districts. On the other hand, the True Finns did not win as much in districts where support for the Centre Party is traditionally strong. The differences in the backgrounds for support are relatively large between different constituencies.
The Social Democratic Party lost the most in the 2008 Municipal elections. The Centre Party lost nearly as much. The election themes of the Social Democrats, namely free day care for children and care for the elderly, do not seem to have been effective. The Social Democrats lost roughly equally in districts with large and small proportions of children and in districts with large and small proportions of elderly persons. The Centre Party lost in sparsely populated districts and agricultural districts, where the Coalition Party recorded a win.
The Green League won especially in city districts where service industries are predominant and where support for the Greens has traditionally been strong.
The result analysis is based on an examination by voting district. The districts, whose borders have not changed since the previous elections, were chosen as the basic data set. It is, therefore, not possible to calculate the election result by summing up the percentages.
Last updated 27.10.2008
Official Statistics of Finland (OSF):
Municipal elections [e-publication].
ISSN=2323-1114. 2008,
Party analysis - True Finns won the day
. Helsinki: Statistics Finland [referred: 15.2.2026].
Access method: http://stat.fi/til/kvaa/2008/kvaa_2008_2008-10-27_kat_002_en.html

