

1. Finland's economy in recession, production of services decreased in the third quarter
In the third quarter, the volume of Finland’s GDP decreased by 0.1 per cent from the previous quarter. Adjusted for working days, gross domestic product was 1.2 per cent down on the third quarter of 2011. Calculated at current prices, GDP adjusted for working days grew by 1.5 per cent year-on-year.
Figure 1. Revisions - seasonally adjusted volume of GDP by release
According to preliminary data, the volume of GDP has now declined in two successive quarters, which can be regarded as the criterion for recession. The combined volume of GDP for the January to September period did not in practice grow at all relative to the corresponding period of last year.
According to preliminary data compiled by Eurostat, GDP in the EU-27 area grew by 0.1 per cent in the third quarter of 2012.
1.1. Production
The volume of total value added generated by all industries went down by 0.5 per cent from the previous quarter and by 1.1 per cent from twelve months back.
In primary production, that is, agriculture, forestry and fishing, the volume of value added was in the third quarter 1.7 per cent smaller than in the previous quarter and 3.3 per cent lower than one year previously. In connection with this release, the indicator for value added in agriculture was changed to be based on output, because the direct evaluation of prices and volumes of value added by quarter has proven difficult due to agricultural subsidies and other special features of the industry.
Value added in manufacturing (industries B-E) was 0.1 per cent up on the previous quarter but 0.3 per cent down on the respective quarter twelve months back.
Figure 2. Value added by industry (chain-linked volumes, working day adjusted), percentage change on corresponding quarter of previous year
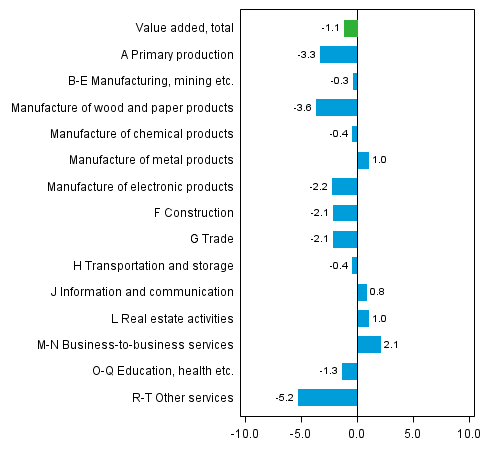
In the July to September period, output in construction diminished by 1.2 per cent from the previous quarter and by 2.1 per cent from one year back.
Value added in services went down by 0.5 per cent from the previous quarter and by 0.9 per cent from the quarter twelve months back. Value added in private services decreased by 0.7 per cent and in public services by 1.0 per cent from the previous quarter.
Value added in trade was 1.1 per cent lower than in the previous quarter and it declined by 2.1 per cent from one year back. Motor vehicle trade decreased further; value added figures have last been as weak as this in early 2010.
1.2. Imports, exports, consumption and investments
In the third quarter, total demand grew by 0.4 per cent from the previous quarter but contracted by 1.7 per cent from twelve months back.
Figure 3. GDP and expenditure components, change from previous quarter (seasonally adjusted, at current prices)
In the July to September period, the volume of exports grew by 2.4 per cent from the previous quarter but was 1.8 per cent down year-on-year. Exports of goods went up by 3.2 per cent from the previous quarter but exports of services decreased by 3.6 per cent.
Imports decreased by 3.7 per cent from the previous quarter and by 4.1 per cent year-on-year. Imports of goods decreased by 3.6 per cent and imports of services by 2.4 per cent from the previous quarter.
In the third quarter, the volume of private consumption grew by 0.8 per cent from the previous quarter and by 0.6 per cent from twelve months back. The volume of public consumption expenditure went up by 0.3 per cent from the previous quarter and was on level with the previous year.
Investments diminished by 1.1 per cent from the previous quarter and by 4.4 per cent year-on-year. Construction investments diminished by 1.4 per cent from the previous quarter and by 4.6 per cent year-on-year. The volume of investments in machinery, equipment and transport equipment increased by 2.5 per cent from the previous quarter but fell by 4.5 per cent year-on-year.
1.3. Employment, wages and salaries and national income
In the third quarter, the number of employed persons went up by 0.1 per cent from the previous quarter and was 0.4 per cent higher than one year previously. The number of hours worked in the national economy increased by 0.1 per cent from the previous quarter and was on level with twelve months back.
According to Statistics Finland’s Labour Force Survey, the rate of unemployment for the July to September period was 7.1 per cent. In the corresponding period of last year it stood at 6.8 per cent.
In the July to September period, the nominal wages and salaries bill of the national economy grew by 0.2 per cent from the previous quarter and by 2.3 per cent year-on-year.
The operating surplus (net), which roughly corresponds with business profit in business bookkeeping, decreased by three per cent at current prices from twelve months back. GDP calculated at current prices was 0.5 per cent lower than one year previously.
1.4. The available data
These preliminary data on the third quarter of 2012 are based on the source information on economic development that had become available by 23 November 2012.
The annual level data for 1990 to 2011 correspond with the National Accounts data released on 12 July 2012, except for those on the rest of the world sector (imports, exports, primary income from/to the rest of the world), which may have become revised. Data concerning the last quarter of 2012 will be released on 1 March 2013, when the data for earlier quarters will also be revised.
Due to the benchmarking and seasonal adjustment methods, quarterly data in the entire time series may become slightly revised in connection with each release. However, the largest revisions take place during the two to three years following the release on a quarter, because final annual accounts data are published at a lag of around two years from the end of the statistical reference year. Seasonally adjusted and trend time series always become revised against new observations irrespective of whether the original time series becomes revised or not.
The quality description can be accessed at (in Finnish): http://tilastokeskus.fi/til/ntp/laa.html
Methodological description of Quarterly National Accounts: http://tilastokeskus.fi/til/ntp/men_en.html
Source: National Accounts 2012, 3rd quarter. Statistics Finland
Inquiries: Pasi Koikkalainen 09 1734 3332, Samu Hakala 09 1734 3756, kansantalous.suhdanteet@stat.fi
Director in charge: Ari Tyrkk�
Updated 5.12.2012
Official Statistics of Finland (OSF):
Quarterly national accounts [e-publication].
ISSN=1797-9765. 3rd quarter 2012,
1. Finland's economy in recession, production of services decreased in the third quarter
. Helsinki: Statistics Finland [referred: 30.7.2026].
Access method: http://stat.fi/til/ntp/2012/03/ntp_2012_03_2012-12-05_kat_001_en.html