

Gross domestic product grew in April to June to the level preceding the coronavirus crisis
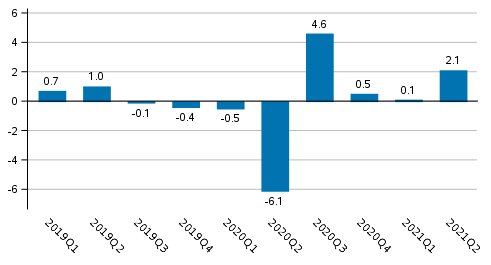
In the April to June period, the seasonally adjusted volume of Finland’s gross domestic product grew by 2.1 per cent from the previous quarter. GDP adjusted for working days went up by 7.5 per cent compared to the second quarter of 2020. Examined at current prices, gross domestic product adjusted for working days was 8.3 per cent higher than one year ago.
Figure 1. Volume change of GDP from the previous quarter, seasonally adjusted, per cent
According to preliminary data compiled by Eurostat, gross domestic product in the EU area increased by 1.9 per cent in the second quarter compared to the previous quarter.
In April to June, Finland’s gross domestic product grew to the level preceding the coronavirus crisis. The national economy had been falling slightly already since mid-2019, but a real economic roller coaster began in March to April 2020, when the spreading of the coronavirus started to be restricted by various measures and health care aimed to ensure readiness for intensive care at hospitals. A distinct recovery was visible in the third quarter of 2020, but new virus mutations and occasional worsening of the disease situation have prevented normal activity in the industries of transport, accommodation, restaurants and other services even this summer. However, the data for the second quarter of 2021 indicate a substantial recovery, even though restrictive measures still hinder the functioning of the above-mentioned services.
Output
The volume of total value added generated by all industries grew by 2.4 per cent from the previous quarter and by 7.7 per cent from twelve months back.
Figure 2. Changes in the volume of value added generated by industries in the second quarter of 2021 compared to one year ago, working day adjusted, per cent
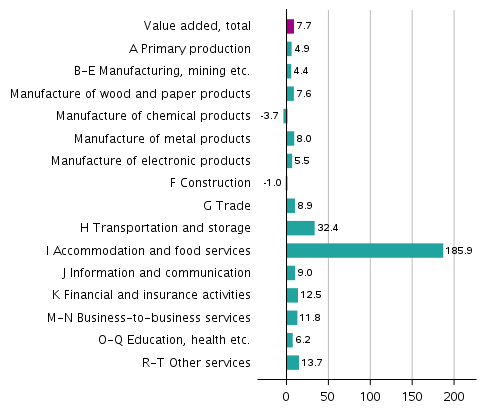
Figure 3. Changes in the volume of value added generated by industries in the second quarter of 2021 compared to the previous quarter, seasonally adjusted, per cent
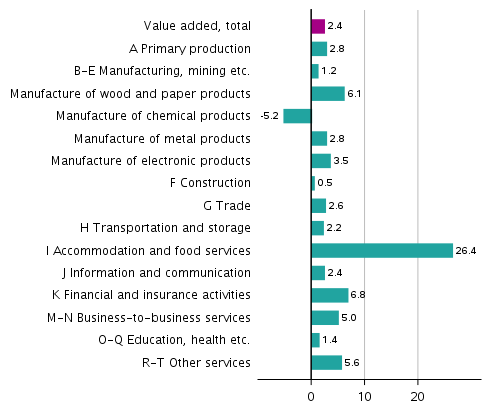
In primary production, that is, agriculture, forestry and fishing, the volume of value added grew in April to June compared with both the previous quarter and the year before.
Output in manufacturing industries (incl. mining and quarrying and energy supply, water supply and waste management) grew in April to June. The forest, metal and electrical and electronics industries increased. The chemical industry contracted, which may at least be partly due to the maintenance shutdown of one major operator. The decline in construction has continued for a long time, but value added made an upturn in April to June compared with the previous quarter.
Service industries grew in the second quarter of 2021. The industries of trade and information and communication have been relatively successful in coping with the coronavirus. The industries of transport and accommodation and food service activities that collapsed one year ago have developed varyingly in line with the corona situation, and in April to June, value added in accommodation and food service activities nearly tripled compared with the previous year.
Imports, exports, consumption and investments
In April to June, total demand grew by 2.2 per cent from the previous quarter. All demand items increased, private consumption grew particularly briskly.
Figure 4. Changes in the volume of main supply and demand items in the second quarter of 2021 compared to one year ago, working day adjusted, per cent
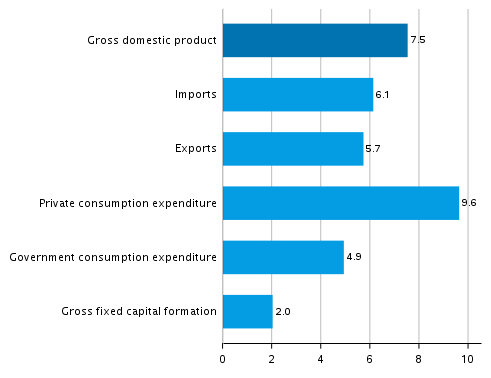
Figure 5. Changes in the volume of main supply and demand items in the second quarter of 2021 compared to the previous quarter, seasonally adjusted, per cent
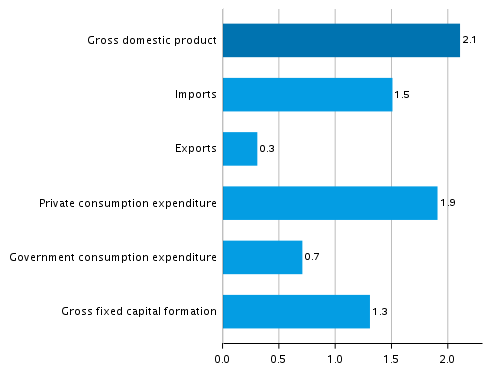
In April to June, the volume of goods exports decreased slightly from the previous quarter, but exports of services increased. In imports, again, the volume of services decreased but imports of goods grew. Prices of international trade in goods rose in the second quarter because compared with one year ago, the value of both goods exports and imports grew clearly more when viewed at current prices than as volume.
Private consumption grew in April to June. Household consumption expenditure on durable and semi-durable goods increased most, but the consumption of non-durable goods and services also grew. Government consumption expenditure increased.
Gross fixed capital formation, or investments, grew. Public investments decreased but private investments grew. Investments in civil engineering that grew last year have turned to a decline. Investments in building construction have varied and turned upwards in the early part of the year. According to revised data, investments in machinery, equipment and transport equipment have been growing already since the second half of 2020, and the growth continued through the second quarter of 2021. Investments in research and development and software have decreased starting from the last quarter of 2020.
Employment, wages and salaries and national income
In April to June, the number of employed persons grew by 3.9 per cent and that of hours worked by 5.4 per cent from one year back. From the previous quarter, the number of hours worked grew by 0.9 per cent.
In the April to June period, the nominal wages and salaries bill of the national economy grew by 1.2 per cent from the previous quarter and by 8.3 per cent year-on-year. Social contributions paid by employers grew by 7.4 per cent from one year back.
The operating surplus (net), which in business bookkeeping corresponds roughly with operating profit, grew in the second quarter by 6.9 per cent from twelve months back. Gross national income calculated at current prices was 9.9 per cent higher than one year previously.
The available data
These preliminary quarterly data are based on the source information on economic development that had become available by 24 August 2021. The annual level data for 1990 to 2020 correspond with the National Accounts data released on 14 July 2021, except for those on the rest of the world sector (imports, exports, primary income from/to the rest of the world), which may have become revised. More detailed data for 2020 will be published on 17 September 2021, when the quarterly accounts database tables will also be updated.
Data concerning the third quarter of 2021 will be released on 30 November 2021. A flash estimate on GDP development for July to September will be released in connection with the Trend Indicator of Output on 16 November 2021.
Due to the benchmarking and seasonal adjustment methods, quarterly data may become slightly revised in connection with each release. However, the largest revisions take place during the two to three years following the release on a quarter, because final annual accounts data are published at a lag of around two years from the end of the statistical reference year. Seasonally adjusted and trend time series always become revised against new observations irrespective of whether the original time series becomes revised or not.
The quality description is available on Statistics Finland's website: http://www.tilastokeskus.fi/til/ntp/laa.html .
Methodological description of Quarterly National Accounts.Source: National Accounts 2021, 2nd quarter. Statistics Finland
Inquiries: Samu Hakala 029 551 3756, Eljas Tuomaala 029 551 2723, kansantalous.suhdanteet@stat.fi
Head of Department in charge: Katri Kaaja
Updated 31.8.2021
Official Statistics of Finland (OSF):
Quarterly national accounts [e-publication].
ISSN=1797-9765. 2nd quarter 2021,
Gross domestic product grew in April to June to the level preceding the coronavirus crisis
. Helsinki: Statistics Finland [referred: 16.7.2026].
Access method: http://stat.fi/til/ntp/2021/02/ntp_2021_02_2021-08-31_kat_001_en.html