Published: 28 November 2019
Students in education leading to a qualification or degree number 1.29 million
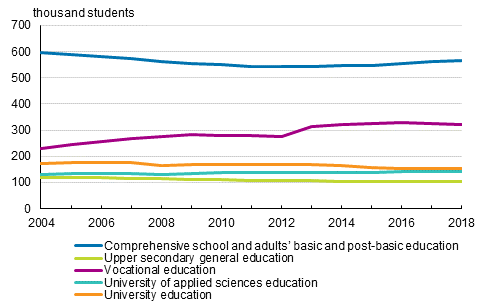
The total number of students in education leading to a qualification or degree was 1.29 million in 2018. The number has remained unchanged compared to the previous year. The number of students grew in comprehensive school education, university of applied sciences education and university education. The number of students in upper secondary school education and vocational education decreased. These data derive from education statistics compiled by Statistics Finland.
Students in education leading to a qualification or degree 2004–2018 1)

1) The data describe the situation on 20 September, except for data on vocational education, which are from the calendar year starting from 2013 and those on preparatory education for a skills examination and apprenticeship training from 2004 onwards.
In 2018, the number of new students totalled 285,300, which is 0.8 per cent lower than in the previous year. The number of pupils entering comprehensive school was two per cent lower and the number of students entering vocational education was three per cent lower than in the previous year. In the other educational sectors, the number of those starting education increased: in upper secondary school education by one per cent, in university of applied sciences education by three per cent and in university education by five per cent.
In 2018, the number of attainers of qualifications or degrees was 226,900, which is 1.6 per cent higher than in the previous year. There were fewer attainers of qualifications or degrees in comprehensive school and university education than in the previous year, whereas in upper secondary school education and vocational and university of applied sciences education the number was higher than in the previous year.
Women the majority in post-comprehensive education
A total of 53 per cent of new students and 55 per cent of attainers of qualifications or degrees were women. Fifty-one per cent of all students were women.
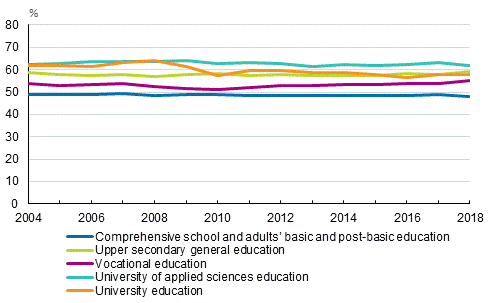
Women were the majority in both new students, students and attainers of qualifications in all post-comprehensive level educational sectors. The share of women among attainers of qualifications remained unchanged or grew slightly in all educational sectors, except university of applied sciences education, compared to the year before. The share of women among attainers of qualifications was highest in university of applied sciences degrees, 62 per cent, and in higher university of applied sciences degrees, 69 per cent. The share of men among attainers of qualifications grew in basic education, university of applied sciences degrees and higher university of applied sciences degrees.
Altogether, 79,600 students completed a vocational qualification in 2018. Fifty-five per cent of them were women. Women made up 52 per cent of attainers of initial vocational qualifications, 62 per cent of attainers of vocational qualifications and 58 per cent of attainers of specialist vocational qualifications. Of all women who attained qualifications, 23 per cent were apprenticeship students.
Women made up 59 per cent of completers of the matriculation examination and 58 per cent of completers of a university degree in 2018.
Women's shares of completers of qualifications in 2004 to 2018, %

The statistics on students and qualifications of educational institutions apply harmonised concepts and classifications to draw an overall picture of education leading to a qualification or degree. The statistics contain data on all the sectors of education. Data on the subject matter are also published in the database tables of these statistics, and on the web pages of the statistics on pre-primary and comprehensive school education, upper secondary general education, vocational education, university of applied sciences education, university education, and adult education of educational institutions. In addition to these, the statistics on the educational structure of population contain information on attainers of qualifications by gender, age group and area, for example.
Source: Education, Statistics Finland
Inquiries: Heli Hiltunen 029 551 3314, koulutustilastot@stat.fi
Director in charge: Jari Tarkoma
Publication in pdf-format (220.2 kB)
- Tables
-
Tables in databases
Pick the data you need into tables, view the data as graphs, or download the data for your use.
Appendix tables
Updated 28.11.2019
Official Statistics of Finland (OSF):
Students and qualifications [e-publication].
ISSN=2737-0410. 2018. Helsinki: Statistics Finland [referred: 22.2.2026].
Access method: http://stat.fi/til/opiskt/2018/opiskt_2018_2019-11-28_tie_001_en.html

