5. Eighty-two per cent of children in families with two parents
Families with children can also be examined by taking the child as the statistical unit instead of the family. Then the results are slightly different. For example, 60 per cent of the families with underage children are those of married couples, but 65 per cent of all children live in families of married couples, because these families have a higher average number of children than families of cohabiting couples or one-parent families. When the children of cohabiting couples and those of registered couples are included in the calculation, 82 per cent of underage children live in families with two parents.
Table 8. Children aged 17 or under by type of family in 1985–2014
| Year | Total | Married couple |
Registered partnership |
Cohabiting couple |
Mother | Father |
| 1985 | 1 136 027 | 959 580 | .. | 61 386 | 102 413 | 12 648 |
| 1990 | 1 135 686 | 916 855 | .. | 91 164 | 113 184 | 14 483 |
| 1995 | 1 150 562 | 858 255 | .. | 125 222 | 148 706 | 18 379 |
| 2000 | 1 116 687 | 777 447 | .. | 156 411 | 162 544 | 20 285 |
| 2005 | 1 084 865 | 727 638 | 131 | 172 898 | 162 875 | 21 323 |
| 2006 | 1 080 728 | 721 911 | 183 | 175 516 | 161 834 | 21 284 |
| 2007 | 1 076 522 | 716 804 | 216 | 176 801 | 161 184 | 21 517 |
| 2008 | 1 071 800 | 713 202 | 277 | 175 986 | 160 730 | 21 605 |
| 2009 | 1 068 554 | 708 684 | 331 | 175 951 | 161 755 | 21 833 |
| 2010 | 1 064 470 | 704 953 | 397 | 175 563 | 161 427 | 22 130 |
| 2011 | 1 061 710 | 701 396 | 500 | 175 981 | 161 575 | 22 258 |
| 2012 | 1 058 664 | 697 517 | 597 | 176 104 | 162 035 | 22 411 |
| 2013 | 1 056 606 | 691 581 | 672 | 178 899 | 162 836 | 22 618 |
| 2014 | 1 055 763 | 685 150 | 797 | 181 515 | 165 203 | 23 098 |
| Per cent | ||||||
| 1985 | 100,0 | 84,5 | .. | 5,4 | 9,0 | 1,1 |
| 1990 | 100,0 | 80,7 | .. | 8,0 | 10,0 | 1,3 |
| 1995 | 100,0 | 74,6 | .. | 10,9 | 12,9 | 1,6 |
| 2000 | 100,0 | 69,6 | .. | 14,0 | 14,6 | 1,8 |
| 2005 | 100,0 | 67,1 | 0,0 | 15,9 | 15,0 | 2,0 |
| 2006 | 100,0 | 66,8 | 0,0 | 16,2 | 15,0 | 2,0 |
| 2007 | 100,0 | 66,6 | 0,0 | 16,4 | 15,0 | 2,0 |
| 2008 | 100,0 | 66,5 | 0,0 | 16,4 | 15,0 | 2,0 |
| 2009 | 100,0 | 66,3 | 0,0 | 16,5 | 15,1 | 2,0 |
| 2010 | 100,0 | 66,2 | 0,0 | 16,5 | 15,2 | 2,1 |
| 2011 | 100,0 | 66,1 | 0,1 | 16,6 | 15,2 | 2,1 |
| 2012 | 100,0 | 65,9 | 0,1 | 16,6 | 15,3 | 2,1 |
| 2013 | 100,0 | 65,5 | 0,1 | 16,9 | 15,4 | 2,1 |
| 2014 | 100,0 | 64,9 | 0,1 | 17,2 | 15,6 | 2,2 |
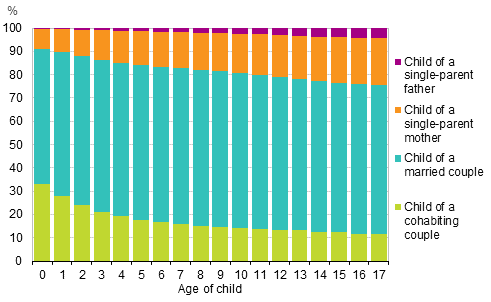
Of all babies aged under one, 91 per cent live with both parents and nine per cent with their mother only (Figure 9).
The share of children living with their father or mother increases with age. In 2014, one-fifth of children aged 17 lived with the mother only, while a decade ago the share was 18 per cent. Respectively, four per cent lived with the father only, which is the same proportion as ten years earlier.
Figure 9. Children by type of family and age in 2014, relative breakdown

5.1 Good one-third of children have at least two siblings
Although 43 per cent of families with children had only one child at the end of 2014, only 24 per cent of the children in these families had no siblings. The status of an only child is temporary for many of these children, as the majority of them will have a sibling later on. Some of these children may also have had an older sibling who has already turned 18 or moved away from home.
At the end of 2014, altogether 42 per cent of all children lived with one sibling and 35 per cent of all children had at least two siblings living at home. In 1985, only 27 per cent of all children had at least two siblings at home.
Table 9. Children by number of underage children in the family in 1985–2014
| Year | Total | Number of underage children in families | |||
| 1 | 2 | 3 | 4 - | ||
| 1985 | 1 136 027 | 306 784 | 518 206 | 221 211 | 89 826 |
| 1990 | 1 135 751 | 286 529 | 500 680 | 243 504 | 105 038 |
| 1995 | 1 150 562 | 284 915 | 484 092 | 257 283 | 124 272 |
| 2000 | 1 116 687 | 268 369 | 461 516 | 255 075 | 131 727 |
| 2005 | 1 084 865 | 255 549 | 451 758 | 245 325 | 132 233 |
| 2006 | 1 080 728 | 254 705 | 451 428 | 242 382 | 132 213 |
| 2007 | 1 076 522 | 254 832 | 450 088 | 238 782 | 132 820 |
| 2008 | 1 071 800 | 253 841 | 449 016 | 235 650 | 133 293 |
| 2009 | 1 068 554 | 254 457 | 447 554 | 232 584 | 133 959 |
| 2010 | 1 064 470 | 254 551 | 445 192 | 230 580 | 134 147 |
| 2011 | 1 061 710 | 253 995 | 443 286 | 229 101 | 135 328 |
| 2012 | 1 058 664 | 252 986 | 441 612 | 227 907 | 136 159 |
| 2013 | 1 056 606 | 250 318 | 441 312 | 227 175 | 137 801 |
| 2014 | 1 055 763 | 247 882 | 440 974 | 228 099 | 138 808 |
| Per cent | |||||
| 1985 | 100,0 | 27,0 | 45,6 | 19,5 | 7,9 |
| 1990 | 100,0 | 25,2 | 44,1 | 21,4 | 9,2 |
| 1995 | 100,0 | 24,8 | 42,1 | 22,4 | 10,8 |
| 2000 | 100,0 | 24,0 | 41,3 | 22,8 | 11,8 |
| 2005 | 100,0 | 23,6 | 41,6 | 22,6 | 12,2 |
| 2006 | 100,0 | 23,6 | 41,8 | 22,4 | 12,2 |
| 2007 | 100,0 | 23,7 | 41,8 | 22,2 | 12,3 |
| 2008 | 100,0 | 23,7 | 41,9 | 22,0 | 12,4 |
| 2009 | 100,0 | 23,8 | 41,9 | 21,8 | 12,5 |
| 2010 | 100,0 | 23,9 | 41,8 | 21,7 | 12,6 |
| 2011 | 100,0 | 23,9 | 41,8 | 21,6 | 12,7 |
| 2012 | 100,0 | 23,9 | 41,7 | 21,5 | 12,9 |
| 2013 | 100,0 | 23,7 | 41,8 | 21,5 | 13,0 |
| 2014 | 100,0 | 23,5 | 41,8 | 21,6 | 13,1 |
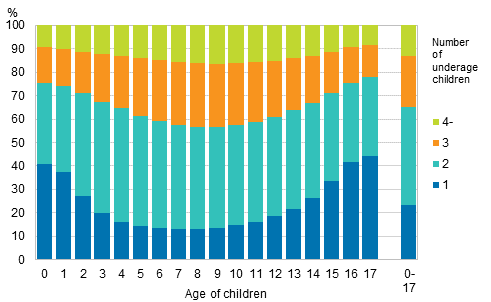
The cross-sectional nature of family statistics is clearly illustrated in Figure 10, which shows the children of families by age and number of children in the family. Here all children living at home and aged under 18 are taken into account when determining the status of an only child. Of children aged under one year, 41 per cent are without siblings, i.e. they are firstborns in their families. The proportion of children without siblings, 13 per cent, is the lowest for children aged 7 to 8.
A second child has most likely been born to a family when the firstborn is aged around seven. On the other hand, the older sibling has only on rare occasions reached the age of 18. Since it can be assumed that some of the 7-year-old children will still have a sibling and some of them already have one who has left home, it can be concluded that some ten per cent of children will remain permanently without siblings. The same results are attained when looking at the number of children according to the number of children born to women in the whole country.
Figure 10 indicates that a child’s family is at its largest when he/she is aged between 8 and 9. Around 44 per cent of children of that age live in families with at least three underage children. Their proportion is the same as in the previous year.
Figure 10. Children by age and number of children aged 17 or under in the family in 2014

5.2 Number of siblings varies much between regions
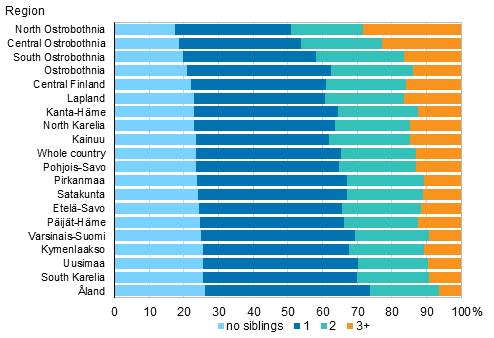
There are also differences in the numbers of siblings by area. In areas where families are bigger, the proportion of children living with several siblings is naturally larger than in areas of small families. In North and Central Ostrobothnia, over one-fifth of children have three or more siblings aged under 18 living at home. In contrast, every tenth child in South Karelia, Varsinais-Suomi and Uusimaa is living with at least three siblings. In Åland, only six per cent of children live with this many siblings.
North and Central Ostrobothnia also have the lowest proportions of children living without siblings − under 20 per cent in both. More than every fourth child living in Kymenlaakso, Uusimaa, South Karelia and Åland has no siblings living at home.
Figure 11. Children by number of siblings by region in 2014, %

In Finnish municipalities, Tyrnävä, Lumijoki, Sievi and Luoto (under 10%) have in relative terms the least children without siblings. In relative terms, the most children without siblings are living in Pelkosenniemi (38%), Sund (35%), Föglö (31%) and in Mariehamn, Helsinki and Turku (31%).
The number of children of large families living with three or more siblings is in relative terms highest in Sievi, Perho and Pyhänne (54%). In addition, over one half of children live in families with at least four children in Lumijärvi, Ranua and Merijärvi. The number of children living with at least three siblings is naturally, in relative terms, highest in municipalities that have the biggest sizes of families with underage children (Section 4.2). In relative terms, the lowest number of children are living with at least three siblings in Åland's Brändö and Sottunga where there are no families with at least four children. They are followed by Hammarland, Kustavi, Korsnäs and Lumparland, where the relative share of families with at least four children is under five per cent. In Mainland Finland, the number of children living with at least three siblings is in relative terms lowest, in addition to Kustavi mentioned above, in Lapinjärvi, Naantali and Närpiö (under 6%).
5.3 Every tenth child is living in a reconstituted family
As in the previous year, 109,200 children (10% of all children) aged under 18 are raised in reconstituted families. Of them, 33,600 are the spouses' common children, that is, born to a family that previously had the mother’s and/or the father’s children only. Altogether, 45 per cent of reconstituted families have had common children born to the family as well. There are 75,600 actual children of reconstituted families (7% of all children), that is, children who have obtained a new social parent. Of these children, 64,900 were brought into the family by their mother and 10,700 by their father.
5.4 Number of children with foreign background is growing
During 2012, Statistics Finland adopted a new classification of origin. Persons whose at least one parent who was born in Finland are considered to be of Finnish background. Also, persons whose parents' data are unknown but whose native language is Finnish, Swedish or Sami are considered to be of Finnish background. Persons whose both parents or the only known parent have been born abroad are considered to be of foreign background. Persons who have been born abroad and whose both parents' data are unknown are also considered to be of foreign background. Using the origin classification, it is easy to distinguish between first (born abroad) and second (born in Finland) generation Finns with a foreign background. The following looks at all children belonging to the population of Finland.
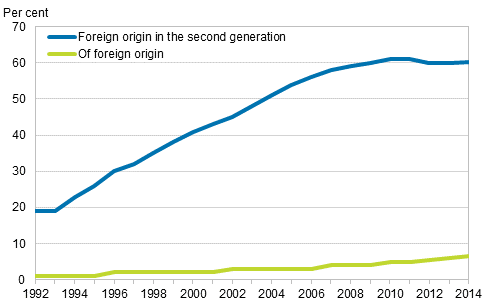
Based on what is stated above, 69,000 or six per cent of all underage children were of foreign background at the end of 2014. During the year, the number of underage children with foreign background has grown by over five thousand. In 1990, there were 3,500 underage children with foreign background in Finland.
Until 2003, there were more children with foreign background in the first generation than in the second generation, but in the following year there were slightly more children with foreign background in the second generation, 51 per cent. At the end of 2014, the share of children with foreign background in the second generation among all children with foreign background was 60 per cent. In recent years, the ratio has remained unchanged.
Forty-five per cent of underage children with foreign background were under school-age. Among all under school-age children with foreign background nearly four out of five were in the second generation. The share has been on the same level for 15 years, although the number of people with foreign background has tripled.
Figure 12. Share of children with foreign origin among all children and share of children of foreign origin in the second generation among all children of foreign origin in 1992 to 2014

Source: Population and Justice Statistics, Statistics Finland
Inquiries: Marjut Pietiläinen 029 551 2798, Timo Nikander 029 551 3250, info@stat.fi
Director in charge: Jari Tarkoma
Updated 27.11.2015
Official Statistics of Finland (OSF):
Families [e-publication].
ISSN=1798-3231. Annual Review 2014,
5. Eighty-two per cent of children in families with two parents
. Helsinki: Statistics Finland [referred: 21.2.2026].
Access method: http://stat.fi/til/perh/2014/02/perh_2014_02_2015-11-27_kat_005_en.html

