This set of statistics has been discontinued.
Statistical data on this topic are published in connection with another set of statistics.
Data published after 5 April 2022 can be found on the renewed website.
1. Review on offences recorded by the police, customs and border guard
1.1. Abstract
In 2011, 458,000 offences were recorded by the police, customs and border guard in the whole country, which is six per cent more than one year before. During ten previous years, the average number of offences recorded was 435,000 per year. Over the year, 271,000 offences were solved, while the corresponding figure was 268,000 one year previously.
The vast majority of the offences were recorded by the police. A total of 11,000 offences were recorded by the customs and border guard, 18 per cent more than one year before. One fifth of the offences recorded by the customs and border guard were alcohol offences or minor alcohol offences and narcotics offences.
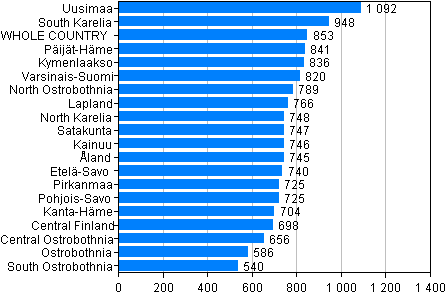
Examined by region, the number of offences from 2010 to 2011 increased in relative terms most in Åland, by 21 per cent and fell most in Kanta-Häme, by four per cent.
Figure 1. Offences by region per 10,000 population in 2011
1.2. Offences against property
The biggest group of the offences recorded was formed by thefts, petty thefts and aggravated thefts. In all, 151,000 of them were recorded, which is two per cent more than one year previously. An average of 159,000 theft offences were reported between 2001 and 2010. The number of 'ordinary' thefts recorded was 75,000, or four per cent more than one year before. The number of aggravated thefts recorded was 3,100. During ten previous years, 2,500 aggravated thefts, on average, were committed per year. Petty thefts numbered 73,000, which figure is unchanged from the year before.
Figure 2. Offences against property 2011 (In total 259,771 offences)
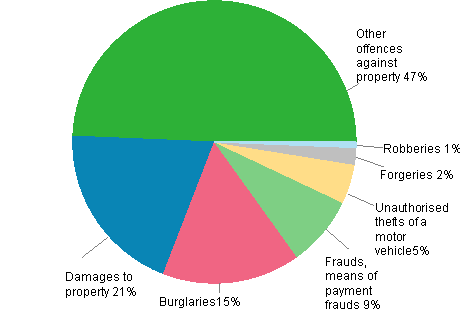
The number of burglaries reported was 40,000, which is 1,100 cases more than in the previous year. The number of burglaries of motor vehicles recorded was 14,000, which is two per cent more than one year previously. Breaking into business premises increased by 11 per cent. The number recorded was now 4,500. From 2001 their number has almost halved. The total number of house-breakings grew by three per cent compared with the previous year. In 2011, their number was 6,700, of which 1,800 where break-ins to cottages.
The recorded number of unauthorised uses and thefts of a motor vehicle and thefts of use of a motor vehicle was 12,000, which was seven per cent more than in the year before.
In 2011, 1,100 accounting and debtor offences were recorded, which figure is unchanged from the previous year. Although the number of these offences is good one half of the record figures for 1996, their number has more than doubled from 1991.
The number of frauds was 18,000, which is 12 more than in 2010. Ten years ago, 11,000 frauds were recorded.
The number of damages to property was 50,000 per year, on average, during the previous ten-year period. Now 55,000 of them were reported, which is 12 per cent more than in the previous year.
The number of robberies reported was 1,600, eight per cent more than in 2010. From 2001 to 2010, the average number of robberies per year has been 1,800.
Table 1. Selected offences against property by region per 10,000 population in 2011
| Region | Burglaries | Unauthorised thefts of a motor vehicle |
Robberies | Damages to property |
Embezzlements | Frauds, means of payment- frauds |
| WHOLE COUNTRY | 735 | 222 | 30 | 1 018 | 60 | 434 |
| Uusimaa | 898 | 303 | 45 | 1 518 | 95 | 527 |
| Varsinais-Suomi | 910 | 309 | 37 | 784 | 51 | 397 |
| Satakunta | 790 | 217 | 23 | 771 | 44 | 324 |
| Kanta-Häme | 639 | 176 | 19 | 766 | 34 | 380 |
| Pirkanmaa | 630 | 120 | 25 | 1 021 | 48 | 365 |
| Päijät-Häme | 849 | 261 | 24 | 928 | 45 | 389 |
| Kymenlaakso | 712 | 207 | 20 | 826 | 35 | 392 |
| South Karelia | 608 | 164 | 22 | 850 | 57 | 327 |
| Etelä-Savo | 858 | 209 | 22 | 823 | 29 | 361 |
| Pohjois-Savo | 537 | 191 | 25 | 850 | 53 | 336 |
| North Karelia | 532 | 134 | 16 | 855 | 39 | 355 |
| Central Finland | 703 | 125 | 25 | 746 | 54 | 323 |
| South Ostrobothnia | 353 | 65 | 9 | 565 | 36 | 369 |
| Ostrobothnia | 599 | 94 | 15 | 814 | 24 | 279 |
| Central Ostrobothnia | 342 | 88 | 4 | 753 | 23 | 239 |
| North Ostrobothnia | 581 | 271 | 27 | 678 | 47 | 405 |
| Kainuu | 531 | 169 | 15 | 847 | 53 | 246 |
| Lapland | 599 | 200 | 17 | 855 | 39 | 346 |
| Åland | 790 | 81 | 11 | 913 | 53 | 236 |
1.3. Offences against the person
In 2011, a total of 40,000 assault offences were recorded, which is one fifth more than in the corresponding period of 2010. Over the period 2001 to 2010 an average of 31,000 assault offences were recorded per year. Aggravated assaults increased by three per cent to 2,100. Most of the increase in the number of assault offences is a result of a legislative amendment that entered into force at the beginning of 2011.
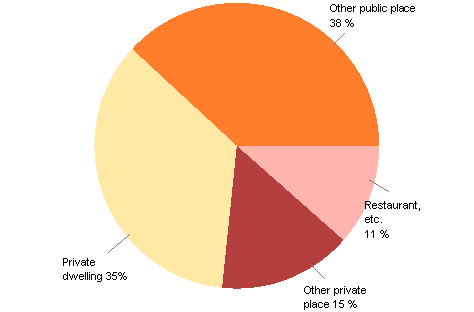
Good one third of assault offences are committed in public places outside business centres and public occasions and in over one third the scene of the assault is a private dwelling.
Figure 3. Assault offences by scene in 2011 (In total 40,171 offences)
The recorded number of offences against life was 114. This was four cases more than in 2010. The annual average was 124 for the ten-year period 2001 to 2010. The corresponding figure was 142 between 1991 and 2000. The number of attempted manslaughters, murders or homicides fell from 308 to 306. The average for the previous ten-year period was 346.
In 2011 nearly two thirds of the offences against life were committed in a private dwelling.
The number of rapes recorded was 1,039, against 818 in the previous year. From 2001 to 2010, an average of 652 rapes were reported. The recorded number of sexual exploitations of a child was 1,682, which is 82 per cent (758 cases) more than the annual average for the period 2001 to 2010. The numbers of rapes and sexual exploitations of a child vary much yearly. Individual reports of an offence may include a series of incidents comprising several criminal acts.
Table 2. Selected violent offences by region per 10,000 population in 2011
| Region | Manslaughter, murder, homicide and their attempts |
Assault | Aggravated assault |
Petty assault |
Rape offences |
| WHOLE COUNTRY | 8 | 495 | 38 | 210 | 19 |
| Uusimaa | 7 | 606 | 35 | 242 | 20 |
| Varsinais-Suomi | 4 | 441 | 31 | 260 | 20 |
| Satakunta | 10 | 481 | 54 | 162 | 12 |
| Kanta-Häme | 8 | 394 | 47 | 206 | 17 |
| Pirkanmaa | 7 | 427 | 32 | 175 | 12 |
| Päijät-Häme | 12 | 435 | 37 | 203 | 14 |
| Kymenlaakso | 8 | 349 | 29 | 217 | 13 |
| South Karelia | 10 | 404 | 30 | 197 | 15 |
| Etelä-Savo | 5 | 458 | 47 | 264 | 14 |
| Pohjois-Savo | 10 | 427 | 36 | 314 | 17 |
| North Karelia | 5 | 369 | 48 | 193 | 40 |
| Central Finland | 8 | 537 | 43 | 137 | 13 |
| South Ostrobothnia | 10 | 382 | 30 | 98 | 12 |
| Ostrobothnia | 10 | 413 | 50 | 121 | 14 |
| Central Ostrobothnia | 6 | 543 | 31 | 250 | 23 |
| North Ostrobothnia | 8 | 557 | 34 | 157 | 35 |
| Kainuu | 15 | 629 | 68 | 202 | 16 |
| Lapland | 9 | 418 | 54 | 223 | 24 |
| Åland | 11 | 356 | 46 | 169 | 28 |
1.4. Drunken driving and traffic offences
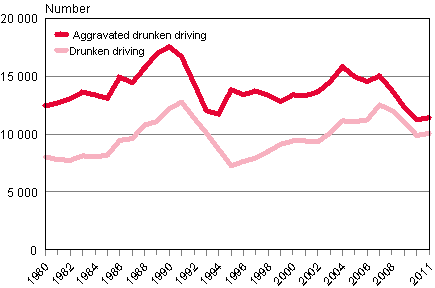
Aggravated drunken driving increased by one per cent and other drunken driving by two per cent. In all, 21,000 drunken driving offences were recorded, which is two per cent more than in 2010. For the past two years the number of drunken driving offences has been at its lowest since the mid-1990s. They have fallen by good one quarter from the 1990 record figures.
Of those suspected of drunken driving 84 per cent had used alcohol and 13 per cent a narcotic substance as their only intoxicant. The remaining three per cent had used both.
Figure 4. Drunken driving offences in 1980–2011
In 2011, 505,000 cases of endangerment of traffic safety and traffic infractions were registered, which is the same as one year before. Most of them were infractions found out in connection with police surveillance and guidance. The recorded number of aggravated endangerment of traffic safety was 4,100, which is 13 per cent more than in 2010. The police recorded 334,000 cases of exceeding speed limits, which figure is unchanged from the year before.
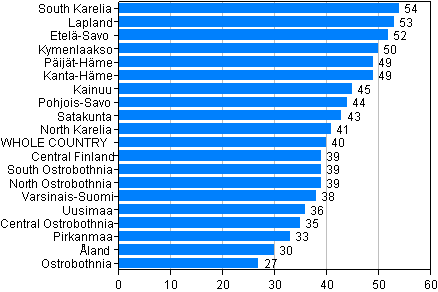
Figure 5. Drunken driving offences by region per 10,000 population in 2011
1.5. Offences involving intoxicating substances
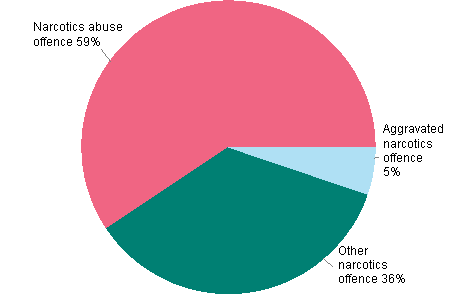
In all, 20,000 narcotics offences were recorded, which is three per cent more than in 2010. Aggravated narcotics offences went down by four per cent to 1,000. During the period 2001 to 2010, the average number of narcotics offences was 16,000 per year.
From 2009 to 2011, the figures including the offences recorded by the customs and border guard increase the number of narcotics offences by six to eight per cent compared with narcotics offences known to the police.
Figure 6. Narcotics offences in 2011 (In total 20,394 offences)
In all, 5,100 alcohol offences and minor alcohol offences were recorded. This is one quarter up on the year before.
When compiling statistics on offences involving intoxicating substances, offences comprising several criminal acts are entered as one. Offences involving intoxicating substances are such that they are generally found out only as a result of the activity of only the police or customs and border guard officials and the majority of the offences remain undisclosed.
1.6. Solved offences
In the course of 2011, the police solved 271,000 offences. The clearance rate was 59 per cent, which is three percentage points lower than in the previous year. The corresponding figure was 53 per cent ten years ago. The clearance rate for offences is calculated so that the offences recorded by the police in the statistical reference year and all the offences solved in that same year are compared with each other.
Thirty-nine per cent of offences against property and 75 per cent of offences against life and health were solved.
Among municipalities of over 30,000 inhabitants the clearance rate was the highest in Seinäjoki and Kotka, 78 and 70 per cent, respectively, while it was the lowest in Helsinki and Vantaa, 51 and 55 per cent, respectively.
The clearance rate varies by type of offence quite strongly. Due to the manner of disclosure, drunken driving, traffic and offences involving intoxicating substances are almost all solved. Nearly 80 per cent of frauds and 81 per cent of offences against life were solved. The clearance rate is 75 per cent for assault offences.
The clearance rates are the lowest for theft offences, damages to property, means of payment frauds and unauthorised thefts of a motor vehicle. In 2011 one sixth of 'ordinary' thefts were solved. One fifth of damages to property and one fourth of means of payment frauds were cleared. Nearly 30 per cent of unauthorised thefts of a motor vehicle were solved. One half of robberies and nearly 60 per cent of rapes were solved.
Table 3. Clearance rate of certain types of offences in 1986–2011
| Offence | 1986-1990 | 1991-1995 | 1996-2000 | 2001-2005 | 2006 | 2007 | 2008 | 2009 | 2010 | 2011 |
| ALL OFFENCES | 65 | 51 | 51 | 56 | 60 | 60 | 62 | 59 | 62 | 59 |
| Theft | 25 | 17 | 14 | 15 | 17 | 18 | 19 | 18 | 18 | 17 |
| Aggravated theft | 39 | 29 | 40 | 41 | 44 | 38 | 40 | 33 | 38 | 34 |
| Petty theft | 78 | 70 | 67 | 58 | 56 | 56 | 57 | 57 | 59 | 57 |
| Robbery | 53 | 43 | 42 | 45 | 45 | 44 | 51 | 50 | 51 | 49 |
| Damages to property | 29 | 27 | 27 | 26 | 26 | 25 | 25 | 24 | 24 | 21 |
| Assault | 79 | 74 | 76 | 80 | 81 | 77 | 85 | 82 | 80 | 75 |
| Aggravated assault | 85 | 84 | 83 | 87 | 91 | 81 | 93 | 89 | 87 | 85 |
| Petty assault | 95 | 86 | 79 | 75 | 73 | 70 | 75 | 73 | 74 | 73 |
| Manslaughter, murder or homicide | 97 | 94 | 90 | 93 | 86 | 79 | 103 | 91 | 97 | 81 |
| Attempted manslaughter, murder or homicide | 95 | 91 | 92 | 94 | 103 | 89 | 104 | 98 | 92 | 91 |
| Rape | 63 | 56 | 57 | 63 | 62 | 60 | 66 | 74 | 69 | 59 |
1.7. Persons suspected of offences
In all, 303,000 persons were suspected of the 271,000 offences solved in 2011. Eighteen per cent of them were women.
In addition to the quantitative difference, the criminality of men and women differs in that women's shares of assaults, drunken driving and damages to property are small compared to men. However, the share of women suspected of assaults and drunken driving has doubled in 20 years. Typical crimes for women are petty thefts, embezzlements and forgeries.
In 2011 the share of young and underage people - aged 21 or under - among all suspects was 24 per cent. The shares of young people were large for alcohol offences, robberies, damages to property and thefts of a motor vehicle. Forty-four per cent of those suspected of robberies were young people. In damages to property the percentage was 47 and in thefts of a motor vehicle 34. The share of young people suspected of assaults was 23 per cent.
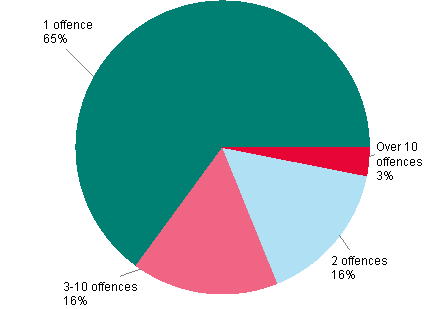
The majority of suspects, 65 per cent, were suspects of one offence in 2011. One third were suspected of two to ten offences and three per cent were suspected of more than ten offences.
Table 4. Suspects of solved offences by age and gender in 2000-2011
| Year | Persons suspected of offences - Age | |||||||||
| Males total |
Females total |
Males aged under 15 |
Females aged under 15 |
Males aged 15–17 |
Females aged 15–17 |
Males aged 18–20 |
Females aged 18–20 |
Males aged over 20 |
Females aged over 20 |
|
| 2000 | 232 810 | 41 520 | 8 002 | 2 812 | 26 554 | 5 003 | 32 204 | 4 593 | 164 050 | 29 112 |
| 2001 | 227 035 | 40 878 | 7 218 | 3 121 | 23 165 | 4 490 | 34 231 | 4 717 | 162 421 | 28 550 |
| 2002 | 226 806 | 38 805 | 6 808 | 2 641 | 20 216 | 4 230 | 34 654 | 5 113 | 165 128 | 26 821 |
| 2003 | 236 391 | 42 097 | 7 600 | 2 590 | 19 033 | 4 127 | 35 161 | 5 300 | 174 597 | 30 080 |
| 2004 | 250 087 | 47 028 | 8 342 | 3 182 | 20 063 | 4 763 | 33 466 | 5 670 | 188 216 | 33 413 |
| 2005 | 250 489 | 46 580 | 7 289 | 3 047 | 22 486 | 4 546 | 31 983 | 5 521 | 188 731 | 33 466 |
| 2006 | 239 264 | 45 093 | 6 934 | 2 725 | 19 296 | 4 093 | 28 830 | 5 783 | 184 204 | 32 492 |
| 2007 | 250 303 | 57 847 | 8 347 | 2 749 | 19 783 | 4 077 | 29 702 | 5 433 | 194 471 | 45 588 |
| 2008 | 257 955 | 50 240 | 10 577 | 3 198 | 20 592 | 4 207 | 30 388 | 5 987 | 196 398 | 36 848 |
| 2009 | 247 229 | 51 298 | 8 846 | 3 172 | 19 049 | 4 635 | 27 261 | 5 923 | 192 073 | 37 567 |
| 2010 | 249 123 | 52 930 | 8 023 | 3 414 | 18 542 | 5 053 | 27 431 | 5 722 | 195 127 | 38 741 |
| 2011 | 248 787 | 53 975 | 9 091 | 3 640 | 19 359 | 5 230 | 28 224 | 5 943 | 192 113 | 39 162 |
Figure 7. Persons suspected of offences by number of offences in 2011
1.8. Victims of offences
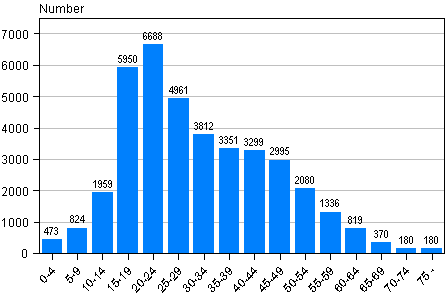
Victims of the assault offences recorded by the police in 2011 numbered 39,000, which is one fifth more than one year earlier. Of the victims 24,000 (61%) were men and 15,000 (39%) women. The number of male victims was 15 per cent and that of female ones 29 per cent higher than in 2010. The typical age of a male victim of an assault was 18, that of a female victim 19. These age groups contain 3,100 (8%) of all victims. In all, 5,000 of those aged 50 or over (13%) were victims of assaults. The amendment to the legislation concerning petty assaults at the beginning of 2011 increased the number of assault offences.
Figure 8. Victims of assault offences by age in 2011
Assaults of children aged 18 or under went up by 18 per cent in 2011 from the year before. One year before the number of child victims was 5,200, now 6,100. This is 15 per cent of all victims of assaults. Among child victims 3,500 (65%) were boys and 2,100 girls (35%). Twelve per cent of the children belonged to the age group of those aged 0 to 6, 41 per cent to those aged 7 to 14 and 46 per cent to those aged 15 to 17.
Source: Offences known to the police 2011. Statistics Finland
Inquiries: Jorma Kallio 09 1734 3248, Marja Kivimäki 09 1734 3252, rikos@stat.fi
Director in charge: Jari Tarkoma
Updated 2.4.2012
Official Statistics of Finland (OSF):
Offences known to the police [e-publication].
ISSN=2242-7953. 2011,
1. Review on offences recorded by the police, customs and border guard
. Helsinki: Statistics Finland [referred: 3.2.2026].
Access method: http://stat.fi/til/polrik/2011/polrik_2011_2012-04-02_kat_001_en.html

