Published: 29 September 2016
Median earnings of wage and salary earners were EUR 2,963 per month in 2015
According to Statistics Finland’s Structure of Earnings statistics, the median of total earnings of full-time wage and salary earners was EUR 2,963 per month in 2015. Besides basic pay, total earnings include all bonuses, overtime pay and benefits in kind, but not performance-based bonuses or holiday bonuses. Total earnings are in gross.
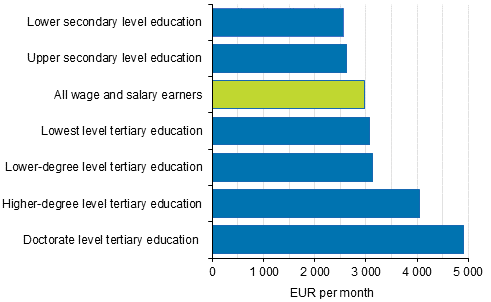
Median of total earnings of full-time wage and salary earners by level of education in 2015

Differences by level of education in median earnings were clear in 2015. The median of total earnings of full-time wage and salary earners with doctorate level education was EUR 4,907 per month, while for those with upper secondary level education, the corresponding earnings were EUR 2,625 per month.
The Structure of Earnings statistics had 242,922 full-time wage and salary earners with lower-degree level tertiary education in 2015. Their median earnings were EUR 3,077 per month: one half earned more than that and one half less than that. Put in another way, 121,461 wage and salary earners with lower-degree level tertiary education earned less than EUR 3,077 per month and 121,461 more than EUR 3,077 per month.
A full-time wage and salary earner refers to a wage or salary earner who has worked a full working week throughout the statistical reference month. A description of educational categories can be found on Statistics Finland's pages (in Finnish only): http://www.stat.fi/meta/luokitukset/koulutusaste/001-2011/kuvaus.html
Pay differentials wide for those with higher-degree level tertiary education
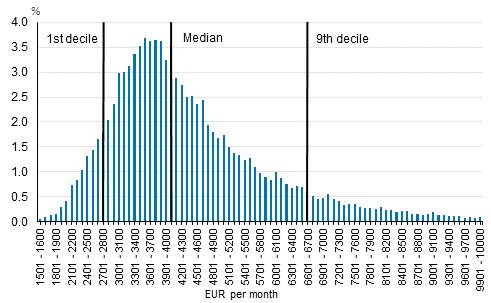
The Structure of Earnings statistics contained around 227,000 full-time wage and salary earners with higher-degree level tertiary education in 2015. Their median earnings amounted to EUR 4,042 per month. The first decile of total earnings was EUR 2,800 per month and the ninth decile EUR 6,664 per month.
The figure below shows the distribution of total earnings of full-time wage and salary earners with higher-degree level tertiary education. The figure indicates how many percentages of wage and salary earners belong to each category of EUR one hundred. For instance, 3.5 per cent of full-time wage and salary earners with higher-degree level tertiary education earned EUR 3,401 to 3,500 per month.
Distribution of full-time wage and salary earners with higher-degree level tertiary education in 2015

In the figure, the first decile is at the total earnings in euros less of which was earned by ten per cent of full-time wage and salary earners with higher-degree level tertiary education. Their number in the Structure of Earnings statistics was around 22,700. Correspondingly, the ninth decile shows the point at which more is earned by ten per cent of full-time wage and salary earners with higher-degree level tertiary education.
The earnings distribution of those with higher-degree level tertiary education has a relatively low peak compared to the earnings distribution of those with lower education than that. This means that earnings are not centred close to each other but they vary relatively much.
One factor explaining the wide earnings distribution is that the earnings of highly-educated people correlate strongly with age. The median for those aged under 40 was EUR 3,582, while the median for those aged 40 or older was EUR 4,413 per month.
Another factor explaining the earnings distribution is the difference in the earnings level between fields of education.
Economics, technology and health in the lead for fields of education
The median of total monthly earnings was highest for those with higher-degree level tertiary education in Health and Welfare (EUR 4,801). The median for total earnings for those with higher-degree level tertiary education in Social Sciences and Business sand Technology was at around EUR 4,300 to 4,500. Earnings were lowest for wage and salary earners with degrees in Teacher Education and Educational Science, and Humanities and Arts.
Total earnings of full-time wage and salary earners with higher-degree level tertiary education by field of education in 2015
| Field of education | Number | 1st decile | Median | 9th decile | Average |
| 1 Teacher Education and Educational Science | 30 463 | 2 805 | 3 602 | 4 634 | 3 684 |
| 2 Humanities and Arts | 33 514 | 2 520 | 3 580 | 4 800 | 3 667 |
| 3 Social Sciences and Business | 64 173 | 2 859 | 4 343 | 7 269 | 4 813 |
| 4 Natural Sciences | 20 363 | 2 604 | 3 977 | 5 705 | 4 138 |
| 5 Technology | 47 165 | 3 142 | 4 520 | 6 932 | 4 856 |
| 6 Agriculture and Forestry | 4 465 | 2 663 | 4 122 | 6 348 | 4 422 |
| 7 Health and Welfare | 21 138 | 2 870 | 4 801 | 8 731 | 5 480 |
| 8 Services | 5 297 | 3 018 | 4 411 | 6 507 | 4 666 |
People with degrees from a few fields of education typically find employment in occupations with high salaries. For example, those with higher-degree level tertiary education in Health and Welfare (e.g. licentiates of medicine) mainly worked as doctors. Those educated in Social Sciences and Business were working in the financial field and as lawyers, for instance. Masters of Science in Technology belonging to the field of Technology worked as professionals in mechanical, electronical and construction engineering.
Persons educated in Social Sciences and Business become managers more often than others
Those whose education background is Social Sciences and Business become managers more often than those from other fields of education. According to the Structure of Earnings statistics data, 14 per cent of those with higher-degree level tertiary education in the field of Social Sciences and Business worked as managers in 2015. This is clearly more than among those educated in Humanities and Arts or Natural Sciences.
The most common occupational groups for managers were such as finance managers, sales and marketing managers, and research and development managers.
Eighty-nine per cent of those with degrees from Teacher Education and Educational Science were working as professionals. This high figure is due to the fact that 83 per cent of those with this education worked in teaching.
Distribution of full-time wage and salary earners with higher-degree level tertiary education into different occupational groups by field of education in 2015
| Field of education | Managers | Professionals | Technicians and associate professionals | Other occupational groups |
| 1 Teacher Education and Educational Science | 6 % | 89 % | 3 % | 2 % |
| 2 Humanities and Arts | 5 % | 76 % | 11 % | 8 % |
| 3 Social Sciences and Business | 14 % | 59 % | 20 % | 7 % |
| 4 Natural Sciences | 6 % | 69 % | 20 % | 5 % |
| 5 Technology | 12 % | 53 % | 31 % | 4 % |
| 6 Agriculture and Forestry | 11 % | 54 % | 25 % | 10 % |
| 7 Health and Welfare | 4 % | 81 % | 13 % | 2 % |
| 8 Services | 6 % | 40 % | 10 % | 44 % |
Forty-four per cent of persons educated in Services belonged to the group "other occupational groups". This is explained by that qualifications of officers completed after 1981 are classified – following the international standard – as part of education in Services, and soldiers as part of the group "other occupational groups". Most of persons with higher-degree level tertiary education in Services are officers, but the group also includes those with a higher university of applied sciences degree in hospitality management.
The preliminary Structure of Earnings statistics for 2015 provide data on the earnings of around 1.6 million wage and salary earners. The data in the statistics are collected from monthly-paid wage and salary earners for September, October or November, and from hourly-paid wage and salary earners for the last quarter of the year. There will be minor revisions to the earnings statistics concerning the level and the field of education in the final version of Structure of Earnings statistics 2015 published in April 2017 as the degree register for the year 2015 will be completed.
Total earnings are measured in the structure of earnings statistics. Apart from basic pay, total earnings also include pay for personal supplements, premium pays, supplement for location and adverse working conditions, supplements based on duties, professional skill and years of service, performance-based pay components, partly compensation for standby and on-call work, pay paid for hours not worked, overtime and working hour supplements, and benefits in kind. Total earnings do not include one-off pay items, such as performance-based bonuses and holiday bonuses.
Source: Structure of Earnings 2015, Statistics Finland
Inquiries: Sampo Pehkonen 029 551 3452, Jukka Pitkäjärvi 029 551 3356, palkkarakenne@stat.fi
Director in charge: Mari Ylä-Jarkko
Publication in pdf-format (226.2 kB)
- Tables
-
Tables in databases
Pick the data you need into tables, view the data as graphs, or download the data for your use.
Appendix tables
Updated 29.9.2016
Official Statistics of Finland (OSF):
Structure of Earnings [e-publication].
ISSN=1799-0092. 2015. Helsinki: Statistics Finland [referred: 5.2.2026].
Access method: http://stat.fi/til/pra/2015/pra_2015_2016-09-29_tie_001_en.html

