Published: 31 August 2020
Median of hourly earnings of wage and salary earners EUR 17.9 in 2019
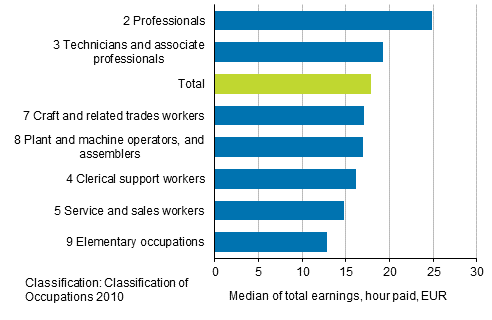
According to Statistics Finland’s Structure of Earnings statistics, wage and salary earners’ median of total earnings per hour worked was EUR 17.9 in 2019. Among occupational groups, professionals and technicians and associate professionals had the highest hourly earnings. In worker occupations, the median of hourly earnings varied between EUR 13 and 17.
Median of total hourly earnings of wage and salary earners according to the main group of the Classification of Occupations in 2019

Besides basic pay and scheduled pay, total earnings include all bonuses, overtime pay and benefits in kind. Total earnings are in gross, that is, taxes or other payments have not been reduced from them.
Total hourly earnings were calculated from monthly earnings based on the hours for which wages and salaries were paid. Thus, the number of hours worked, short sickness absences or grey overtime work do not affect hourly earnings.
Lowest decile of experts corresponds to the median for worker occupations
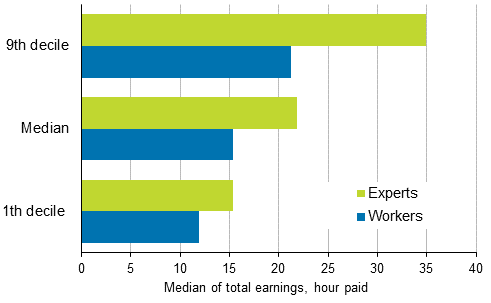
The lowest decile of hourly earnings for experts was of the same magnitude as the median for worker occupations. Thus, earnings in expert occupations were at their lowest as much as a typical wage and salary earner in a worker occupation earned per hour paid in 2019.
Correspondingly, the median of total hourly earnings of experts (EUR 21.9) was of the same size as the highest earnings of workers, i.e. those of the 9th decile (EUR 21.2).
Total earnings of experts and workers per paid hour in 2019

Median earnings are obtained when wage and salary earners are placed in order of size according to their earnings and the middle wage and salary earner is selected. The lowest, or the 1st decile, refers to the euro amount, less of which is earned by 10 per cent of wage and salary earners, and the 9th decile refers to the euro amount, more of which is earned by 10 per cent of wage and salary earners.
Experts include categories 2 Professionals and 3 Technicians and associate professionals in the official Classification of Occupations.
Worker occupations consist of categories 4 Clerical support workers, 5 Service and sales workers, 7 Craft and related trades workers, 8 Plant and machine operators, and assemblers, and 9 Elementary occupations. According to the classification, workers here also include wage and salary earners working as salaried employees.
In 2019, the most typical occupations of experts were nurses, software planners and sales representatives. On the worker side, most wage and salary earners worked as social work assistants, cleaners and transport and storage labourers.
Experts typically highly educated
The data for the Structure of Earnings statistics were collected from September to December. The Structure of Earnings statistics for 2019 provide data on the earnings of around 1.7 million full-time and part-time wage and salary earners. The statistics cover wage and salary earners working in the public sector and in enterprises with more than five employees in the private sector.
Of wage and salary earners, 775,000 were experts and 844,000 workers. There were 75,000 managers, soldiers and wage and salary earners of unknown occupational groups.
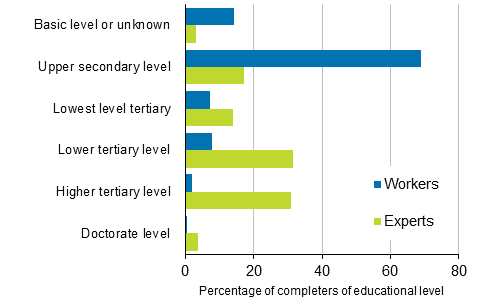
Around 80 per cent of experts had at least lowest level tertiary education. In worker occupations, around 81 per cent had at most upper secondary level education, that is, upper secondary general or vocational school level qualifications.
Share of wage and salary earners by the highest completed qualification in expert and worker occupations in 2019

Working part-time was clearly more common in worker occupations in 2019. Of workers 25 per cent worked part-time, while the corresponding percentage for experts was 10 per cent. Thus, the differences in hourly earnings between expert and worker occupations accumulate on the monthly and annual level due to shorter working hours of workers.
According to the Structure of Earnings statistics, 59 per cent of public sector employees worked in expert tasks. The corresponding figure in the private sector was 40 per cent.
Source: Structure of Earnings 2019, Statistics Finland
Inquiries: Sampo Pehkonen 029 551 3452, Jukka Pitkäjärvi 029 551 3356, palkkarakenne@stat.fi
Director in charge: Mari Ylä-Jarkko
Publication in pdf-format (219.1 kB)
- Tables
-
Tables in databases
Pick the data you need into tables, view the data as graphs, or download the data for your use.
Appendix tables
Updated 31.8.2020
Official Statistics of Finland (OSF):
Structure of Earnings [e-publication].
ISSN=1799-0092. 2019. Helsinki: Statistics Finland [referred: 5.2.2026].
Access method: http://stat.fi/til/pra/2019/pra_2019_2020-08-31_tie_001_en.html

