Published: 8 April 2020
Re-exports accounted for seven per cent of Finland’s total exports in 2016
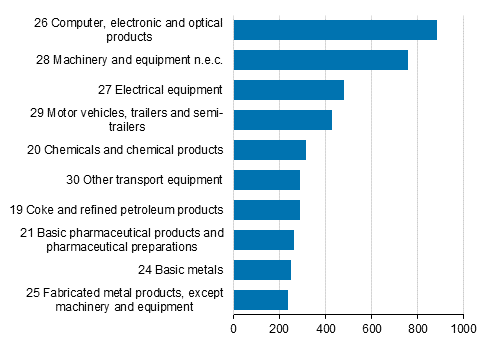
According to Statistics Finland's input-output statistics, the share of re-exports in the total value of exports of goods and services at purchaser’s prices was seven per cent in 2016. The value of re-exports was biggest in exports of computers, electronic and optical products.
In addition to goods manufactured in Finland, exports of goods from Finland include goods imported to Finland that are produced abroad. According to the definition of national accounts, imports are recorded when economic ownership of goods changes from a foreign economic unit to a domestic economic unit. Exports are recorded when economic ownership changes from a domestic economic unit to a foreign economic unit.
Re-exports refer to goods whose imports are followed by exports without change of ownership in Finland and without significant change to the product. However, the packaging of products can be changed or products can be stored in Finland. Re-exports do not include transit nor return of products to the original importing country.
Biggest product groups of re-exports at purchaser's prices in 2016, EUR mil.

The use table of imports included in the input-output statistics describes the distribution of use of imports by product into intermediate consumption of different industries, consumption expenditure, gross fixed capital formation and imports-based exports, that is, re-exports. The use table of imports presents imports at basic prices, that is, without taxes on products but with regard to subsidies. The supply is typically presented at basic prices.
The use table included in input-output statistics describes the distribution of the supply of products (domestic output and imports) into industries’ intermediate consumption, domestic final use and exports by area. The use is typically presented at purchaser’s prices or prices that the purchaser actually pays for the products. It does not include subsidies received by the producer, but it contains trade and transport margins and all other taxes on products except deductible value added tax. The use table is available at both purchaser’s prices and basic prices. Being at basic prices, re-exports presented in the use table of imports are not directly comparable to export sources that are typically at purchaser’s prices.
Particularly in national economies where the share of re-exports is big in exports, it is useful to examine separately exports adjusted for re-exports, because the effect of re-exports on the domestic economy is different compared to exports generated from domestic production.
Statistics Finland publishes annually the supply and use tables describing product flows in the national economy, and the input-output and analysis tables derived from them. The data published now concern the year 2016. Tables concerning 2017 will be published in November 2020.
Source: Input-output 2016, Statistics Finland.
Inquiries: Markku Räty 029 551 2647, Ville Lindroos 029 551 3323, Merja Myllymäki 029 551 3533, kansantalous@stat.fi
Director in charge: Jan Nokkala
Publication in pdf-format (166.6 kB)
- Tables
-
Tables in databases
Pick the data you need into tables, view the data as graphs, or download the data for your use.
Updated 8.4.2020
Official Statistics of Finland (OSF):
Input-output [e-publication].
ISSN=1799-201X. 2016. Helsinki: Statistics Finland [referred: 15.2.2026].
Access method: http://stat.fi/til/pt/2016/pt_2016_2020-04-08_tie_001_en.html

