Published: 27 May 2020
Most free-time residences were built in Kuusamo in the 2000s
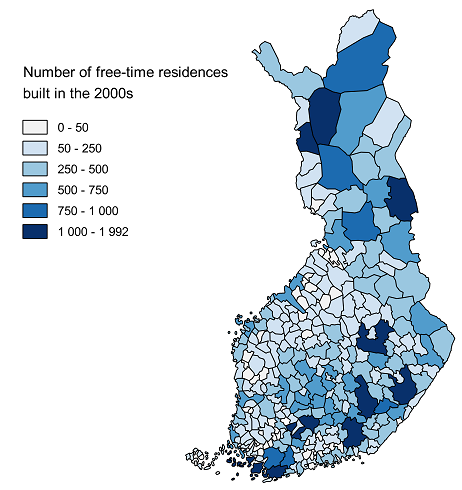
According to Statistics Finland, there were 511,900 free-time residences in Finland in 2019, over 2,000 more than in the year before. Around 95 per cent of free-time residences were owned by private persons or heirs. In the 2000s, the highest numbers of free-time residences have been built in Lapland and South Savo, over 8,000 in both regions.
New free-time residences built in the 2000s by municipality

Only around one thousand free-time residences were built in Åland and Central Ostrobothnia. Among municipalities, the highest numbers of new free-time residences were built in Kuusamo, Mikkeli and Savonlinna, over 1,500 in 2000 to 2019. More than one thousand free-time residences were built in eleven municipalities. In 2010 to 2019, a total of 34 per cent fewer new free-time residences were completed than in the previous decade. During 2010 to 2019, altogether 32,500 new free-time residences were completed, while during 2000 to 2009 the number of new free-time residences was 48,900.
As in the previous years, Kuopio and Mikkeli had the highest numbers of free-time residences in 2019. Among the municipalities with the highest numbers of free-time residences, there were two, Parainen and Kuusamo, with a household-dwelling population of under 15,000 in 2019.
Municipalities with highest number of free-time residences in 2019
| Regional division based on municipalities on 1 Jan. 2020 | Number of free-time residences | |
| 1. | Kuopio | 10 847 |
| 2. | Mikkeli | 10 558 |
| 3. | Parainen | 8 904 |
| 4. | Lohja | 8 500 |
| 5. | Savonlinna | 8 492 |
| 6. | Hämeenlinna | 8 423 |
| 7. | Kouvola | 7 795 |
| 8. | Salo | 7 058 |
| 9. | Kuusamo | 6 964 |
| 10. | Raasepori | 6 672 |
Most summer residents relative to the household-dwelling population in South Savo
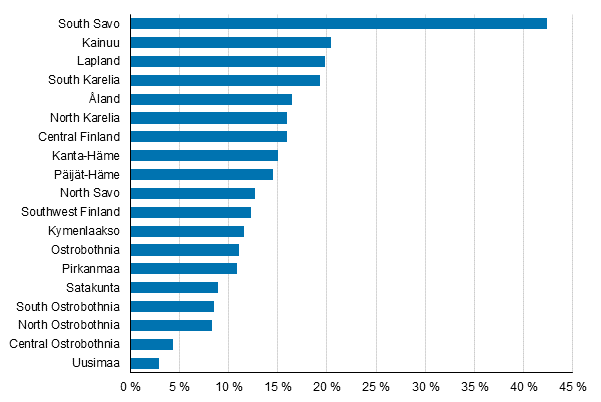
There were close on 560,000 summer residents in Finland in 2019. Examined by region, the share of summer residents relative to the household-dwelling population was highest in South Savo, where the share of summer residents among the household-dwelling population in the region was 42 per cent. Of the municipalities of South Savo, the highest numbers of summer residents were found in Puumala and Hirvensalmi, where the number of summer residents is over double that of the household-dwelling population. In Kainuu, Lapland and South Karelia, the share of summer residents was around 20 per cent relative to the size of the household-dwelling population. The share of summer residents relative to the household-dwelling population was lowest in Uusimaa, where summer residents made up only three per cent of the household-dwelling population. Of municipalities, the number of summer residents was highest in Kustavi in Southwest Finland, where the number of summer residents was nearly five times higher than that of the household-dwelling population.
Share of summer residents of the household-dwelling population in 2019, %

The number of summer residents is calculated from the total number of persons in the household-dwelling unit that owns the free-time residence. Persons whose free-time residence is located in the municipality of residence are not included in the number of summer residents. If a person from another municipality owns more than one free-time residence in the same municipality, the persons in that household-dwelling unit have been counted as summer residents in the municipality only once. Free-time residences owned by heirs, jointly owned or owned by foreigners could not be taken into account when calculating the number of summer residents.
Source: Buildings and Free-time Residences, Statistics Finland
Inquiries: Anu Rämö 029 551 3450, Arja Tiihonen 029 551 3272, info@stat.fi
Director in charge: Jari Tarkoma
Publication in pdf-format (423.2 kB)
- Reviews
-
- Free-time Residences 2019 (27.5.2020)
- Building stock 2019 (27.5.2020)
- Tables
-
Tables in databases
Pick the data you need into tables, view the data as graphs, or download the data for your use.
Appendix tables
- Appendix table 1. Number of buildings, dwellings and persons by type of building and number of storeys 31 Dec. 2019 (27.5.2020)
- Appendix table 2. Number of buildings by intended use in 1980 - 2019 (27.5.2020)
- Appendix table 3. Number of buildings by heating fuel 1970-2019 (27.5.2020)
- Appendix table 4. Number of buildings by construction material 1960-2019 (27.5.2020)
- Appendix table 5. Number of privately owned free-time residences by owner 2019 (Appendix table was corrected 27 May 2020. The corrected numbers are indicated in red) (27.5.2020)
Updated 27.5.2020
Official Statistics of Finland (OSF):
Buildings and free-time residences [e-publication].
ISSN=1798-6796. 2019. Helsinki: Statistics Finland [referred: 6.2.2026].
Access method: http://stat.fi/til/rakke/2019/rakke_2019_2020-05-27_tie_001_en.html

