Published: 31 May 2012
Cubic volume covered by granted building permits fell by 27 per cent in the first quarter of 2012
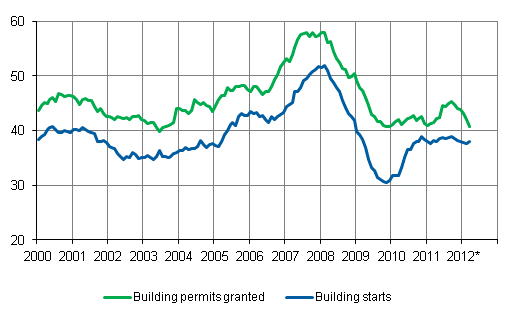
According to the preliminary data of Statistics Finland's statistics on building and dwelling production, in the first quarter of 2012 building permits were granted for a total of 6.5 million cubic metres, which is 27.1 per cent less than one year ago. The cubic volume covered by permits for residential buildings decreased by 18.5 per cent from one year back.
Granted permits and building starts, mil. m3, variable annual sum

In the release the data indicated with an asterisk (*) are preliminary data.
Cubic volume covered by granted building permits decreased by nearly 24 per cent in March
In March 2012, building permits were granted for a total of 2.7 million cubic metres, which is 23.9 per cent less than one year earlier. This is indicated by Statistics Finland’s preliminary data from statistics on building and dwelling production.
The cubic volume covered by permits for residential buildings decreased by 30.2 per cent in March. The biggest decrease of 57.7 per cent was recorded in the cubic volume covered by permits for terraced houses. The cubic volume covered by permits for residential blocks of flats fell by 42.4 per cent and that for detached houses by 13.2 per cent.
The cubic volume covered by permits granted for other than residential buildings was 20.5 per cent lower this March than in March 2011.
The cubic volume covered by permits for industrial and warehouse buildings decreased by 32.3 per cent from 12 months back. The cubic volume covered by permits granted for commercial and office buildings fell by 15.7 per cent.
In March 2012, building permits were granted for 2,438 new dwellings, which is one-quarter down on one year earlier. Especially the numbers of permits for dwellings in terraced houses and residential blocks of flats contracted strongly.
Volume of newbuilding fell by three per cent in March
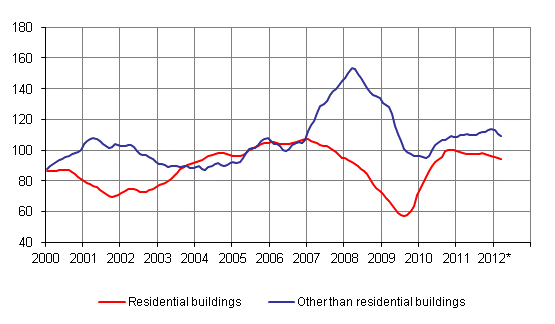
In March 2012, the constant-price value or the volume of ongoing building production was down by 3.1 per cent year-on-year. The volume of residential building construction contracted by 5.3 per cent from March 2011.
The volume of residential building construction has been falling since autumn 2011. The volume of detached house construction has been contracting since spring of last year. In March, the volume of construction of detached houses diminished by 8.2 per cent from one year back. At the same time, the volume of construction of residential blocks of flats contracted by 1.4 per cent and that of terraced houses by 2.5 per cent. The volume of other than residential building construction contracted by one per cent.
The volume of construction of industrial and warehouse buildings decreased by one per cent and that of commercial and office buildings by 1.9 per cent from one year ago.
In March, the biggest year-on-year decrease of 11.6 per cent was seen in the volume of construction of public service buildings.
Volume index for newbuilding 2005=100, trend

Source: Building and dwelling production, Statistics Finland
Inquiries: Merja Järvinen 09 1734 2458, Heli Suonio 09 1734 2481
Director in charge: Hannele Orjala
Publication in pdf-format (357.5 kB)
- Tables
-
Tables in databases
Pick the data you need into tables, view the data as graphs, or download the data for your use.
Appendix tables
- Appendix table 1. Building permits, 1000 m3 (31.5.2012)
- Appendix table 2. Building permits monthly, 1000 m3 (31.5.2012)
- Appendix table 3. Building permits for dwellings, No. (31.5.2012)
- Appendix table 4. Building permits by region (31.5.2012)
- Appendix table 5. Volume index of newbuilding 2005=100 (31.5.2012)
- Appendix table 6. Newbuilding 1. quarter, 2012*, mil. m3 (31.5.2012)
- Appendix table 7. Building permits, mil. m3 (31.5.2012)
- Appendix table 8. Building starts, mil. m3 (31.5.2012)
- Appendix table 9. Building completions, mil. m3 (31.5.2012)
- Appendix table 10. Volume index of newbuilding 2005=100 (31.5.2012)
- Appendix table 11. Dwelling construction by building type 2003-2012, number, building permits and building starts (31.5.2012)
- Appendix table 12. Dwelling constructions by building type 2003-2012, number, buildings under construction and building completions (31.5.2012)
- Figures
-
- Appendix figure 1. Housing production, sliding annual sum (31.5.2012)
- Appendix figure 2. Office and commercial buildings, sliding annual sum (31.5.2012)
- Appendix figure 3. Industrial buildings and warehouses, sliding annual sum (31.5.2012)
- Appendix figure 4. Volume index for newbuilding 2005=100, annual change % (31.5.2012)
Updated 31.5.2012
Official Statistics of Finland (OSF):
Building and dwelling production [e-publication].
ISSN=1798-9590. March 2012. Helsinki: Statistics Finland [referred: 3.2.2026].
Access method: http://stat.fi/til/ras/2012/03/ras_2012_03_2012-05-31_tie_001_en.html

