Published: 23 October 2018
Cubic volume covered by granted building permits continued to fall in June to August
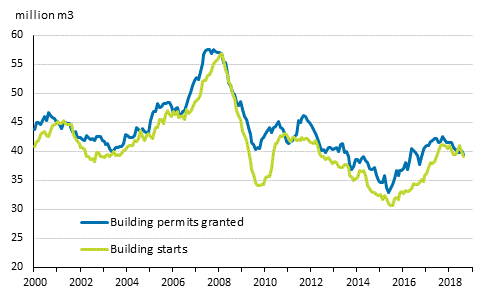
According to Statistics Finland, the cubic volume covered by granted building permits fell by 4.0 per cent in the June to August period of 2018 from one year ago. The cubic volumes of commercial and office building construction were still considerably lower than in the same period one year earlier. The cubic volume of residential building construction also decreased considerably. Measured in cubic volume covered by building permits, only industrial and warehouse buildings showed growth.
Granted building permits and building starts, mil. m3, moving annual total

Fewer permits granted for residential building construction
In June to August, cubic metres covered by permits for residential buildings amounted to 3.1 million, while one year earlier, the figure was 3.7 million. Residential building construction decreased by 15.6 per cent. The cubic volume covered by permits for residential blocks of flats decreased by 12.3 per cent, which was still affected by the high cubic volume of permits one year ago. The cubic volume granted for detached houses went down by 17.6 per cent from one year back. Building permits were granted in total for 10,331 dwellings in June to August. The figure was 14.8 per cent lower than one year earlier.
Volume of building production is still growing
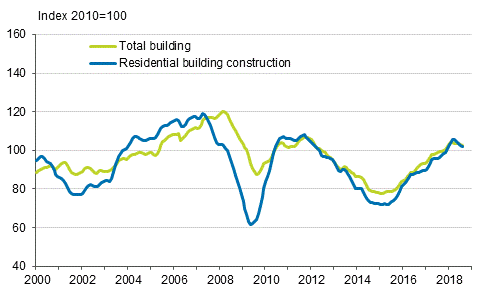
In June to August 2018, the constant-price value or the volume of ongoing building production increased by 4.2 per cent year-on-year. The volume of residential building construction increased by 6.9 per cent during the period and that of other than residential building construction by 2.0 per cent. Measured by volume, 8.0 per cent fewer building projects than one year earlier were started in the same period. The number of residential building starts was 7.0 per cent higher than one year ago.
Volume index of newbuilding 2010=100, trend

Source: Building and dwelling production, Statistics Finland
Inquiries: Paavo Kokkonen 029 551 3028, Merja Järvinen 029 551 2458, Heli Suonio 029 551 2481, rakennus.suhdanne@stat.fi
Director in charge: Mari Ylä-Jarkko
Publication in pdf-format (220.2 kB)
- Tables
-
Tables in databases
Pick the data you need into tables, view the data as graphs, or download the data for your use.
Appendix tables
- Revisions in these statistics
-
- Revisions in these statistics (23.10.2018)
Updated 23.10.2018
Official Statistics of Finland (OSF):
Building and dwelling production [e-publication].
ISSN=1798-9590. August 2018. Helsinki: Statistics Finland [referred: 16.2.2026].
Access method: http://stat.fi/til/ras/2018/08/ras_2018_08_2018-10-23_tie_001_en.html

