This set of statistics has been discontinued.
New data are no longer produced from the statistics.
Published: 9 April 2014
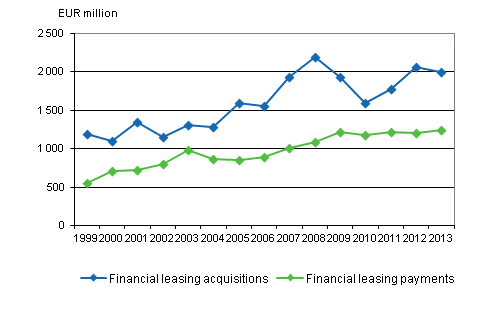
Financial leasing acquisitions EUR 2.0 billion in 2013
Financial leasing acquisitions stood at EUR 2.0 billion in 2013. Compared with the previous year, acquisitions decreased by four per cent. Financial leasing payments in turn amounted to EUR 1.2 billion, or three per cent more than in 2012. Financial leasing companies' sales of leasing objects stood at EUR 632 million, which was nine per cent less than in the previous year. These data derive from Statistics Finland’s Financial leasing statistics.
Financial leasing acquisitions and payments in 1999-2013, EUR million

The largest financial leasing object was IT and other office equipment, which represented 34 per cent of leasing acquisitions in 2013. The second largest group was vehicles with a 33 per cent share and machines and industrial equipment with a 15 per cent share.
Measured by leasing payments, the most significant financial leasing users by industry were trade, transport and storage, and manufacturing. In total, these three industries generated more than one-half of all leasing payments. The clearly largest user of financial leasing by sector was non-financial corporations and housing corporations that paid 84 per cent of all leasing payments.
During 2013, there were 21 companies actively involved in financial leasing in Finland, of which eight were credit institutions and 13 other companies. The biggest financial leasing companies were credit institutions that received 85 per cent of all leasing payments.
Source: Financial leasing 2013, Statistics Finland
Inquiries: Kristiina Nieminen 09 1734 2957, Olavi Savolainen 09 1734 3303, rahoitusmarkkinat@stat.fi
Director in charge: Leena Storgårds
Publication in pdf-format (221.2 kB)
- Tables
-
Tables in databases
Pick the data you need into tables, view the data as graphs, or download the data for your use.
Appendix tables
- Appendix table 1. Financial leasing by lessee sector in 2013, EUR million (the table was corrected) (9.4.2014)
- Appendix table 2. Financial leasing objects in 2013 by product group, EUR million (the table was corrected) (9.4.2014)
- Appendix table 3. Financial leasing by industry in 2013, EUR million (9.4.2014)
- Figures
Updated 9.4.2014
Official Statistics of Finland (OSF):
Financial leasing [e-publication].
ISSN=2343-0982. 2013. Helsinki: Statistics Finland [referred: 10.2.2026].
Access method: http://stat.fi/til/rlea/2013/rlea_2013_2014-04-09_tie_001_en.html

