1. Review on offences recorded by the police, customs and border guard
1.1. Summary
A total of 823,500 offences were recorded in 2016 by the police, customs and border guard in the whole country, which was 4,400 offences (0.5 per cent) more than one year before. Of the recorded offences, 466,900 were offences against the Penal Code, i.e. offences defined in the Penal Code. Compared with 2015, the number of offences against the Penal Code decreased by 7,500 (1.6 per cent). The number of offences against the Penal Code reported has fallen from 2011, when 531,800 offences were reported. Over the year, 285,400 offences against the Penal Code were solved, while the corresponding figure was 295,300 one year previously. Of all recorded offences, 635,100 were solved. A majority of offences outside the Penal Code consists of traffic infractions, violations of social welfare legislation on road traffic and motor vehicle infractions.
The vast majority of the offences was recorded by the police. A total of 15,500 offences were recorded by the customs and border guard, which was 1.9 per cent of all offences reported to the authorities. Altogether, 9,500 offences were recorded by the customs, which was equal to 2015. A total of 6,000 offences were recorded by the border guard, which was 12 per cent more than one year before. Around one-quarter of the offences recorded by the customs and border guard were alcohol offences or minor alcohol offences and narcotics offences.
Examined by region, the number of offences against the Penal Code increased in the regions of Central Ostrobothnia (+9.7%), �land (+6.3%), Uusimaa (+3.5%), and South Ostrobothnia (+1.9%). The number of offences fell most in relative terms in the region of Etel�-Savo by 11.9 per cent from the year before.
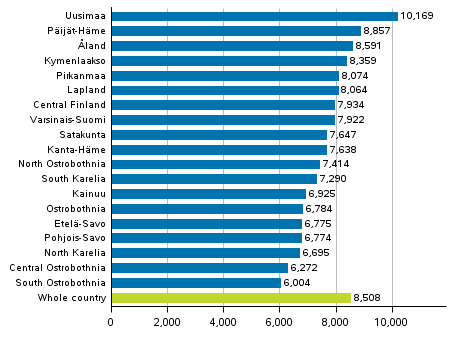
Relative to the population, the highest numbers of offences were recorded in the regions of Kymenlaakso and P�ij�t-H�me. In the whole country, 8,508 offences per 100,000 population were recorded while the corresponding figure in 2015 was 8,645.
Figure 1. Offences against the Criminal Code by region per 100,000 population in 2016
During 2016, altogether 3,300 identity thefts were recorded. Identity theft was added to the Penal Code on 4 September 2015 and during 2015 a total of 518 cases of identity theft were reported. During 2016, a total of 960 identity thefts were solved.
1.2. Offences against property
In 2016, a total of 230,200 offences against property were recorded, which was 2.6 per cent lower than the year before. Among offences against property, theft offences (theft Penal Code, Section 28, Paragraph 1, aggravated theft Section 28, Paragraph 2, and petty theft Section 28, Paragraph 3) formed the biggest group. In all, 131,400 of them were reported, which was five per cent fewer than one year previously. The number of theft offences has mainly been falling throughout the 2000s. The number of thefts (Penal Code, Section 28, Paragraph 1) recorded in 2016 was 64,100, or 7.3 per cent fewer than one year before. The recorded number of aggravated thefts (Penal Code, Section 28, Paragraph 2) was 3,400, which was 4.9 per cent fewer than in 2015. The number of petty thefts (Penal Code, Section 28, Paragraph 3) recorded was 64,000, which was 2.6 per cent lower than in 2015. One-third (46,800) of all theft offences were thefts and petty thefts from shops. Compared with 2015, the number of thefts from shops fell by 1.8 per cent.
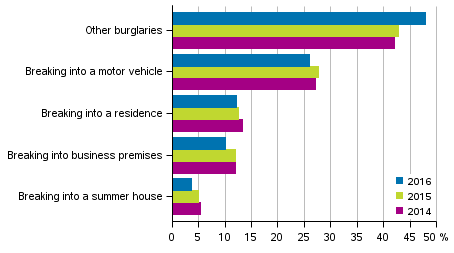
The number of burglaries (thefts, aggravated thefts or petty thefts through unlawful breaking in) reported was 33,300, which was 2.5 per cent fewer than in 2015. The number of break-ins into free-time residences decreased by 27.1 per cent. A total of 1,200 of them were reported in 2016. Breaking into residences went down by 5.3 per cent from the previous year. A total of 4,100 of them were recorded. Breaking into a motor vehicle decreased by 8.3 per cent.
Figure 2. Burglaries 2016
One-sixth of property offences were damages to property. In all, 35,200 of them were recorded, which was 6.5 per cent lower than in 2015. The number of damages to property has been on the decline for a few past years. Good one-half of damages to property were committed in public places.
The number of frauds (fraud Penal Code, Section 36, Paragraph 1, petty fraud Section 36, Paragraph 2, aggravated fraud Section 36, Paragraph 3) recorded was 25,100, which was 3.9 per cent fewer than in 2015. Frauds make up around one-tenth of offences against property. In all, 15,100 means of payment frauds were recorded, which was 38.6 per cent more than in 2015. The number of both frauds and means of payment frauds has mainly been growing over the past ten years.
In 2016, a total of 1,250 accounting and debtor offences were recorded, which was 5.6 per cent lower than in the previous year. Forgery offences (forgery, petty forgery, aggravated forgery, possession of forgery materials Penal Code, Section 33, Paragraphs 1 to 4) recorded was 2,600, which was 4.9 per cent down on 2015. The number of recorded forgery offences has been declining almost throughout the 2000s. In 2010, a total of 4,600 of them were recoded and in 2000 a total of 6,200.
The number of robberies reported was 1,670, which was 7.9 per cent more than in 2015, when 8.2 per cent fewer of them were reported than in 2014. Of the robbery offences, 1,250, or 75.5 per cent, took place in a public place in 2016. Of the robberies, 16.6 per cent were aggravated.
Figure 3. Offences against property 2016 (In total 230,174 offences)
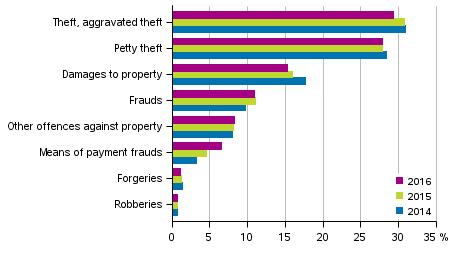
Table 1. Selected offences against property by region per 100,000 population in 2016
| Region | All offences against property | Burglaries | Unauthorised thefts of a motor vehicle | Robberies | Damages to property | Embezz- lements | Frauds, means of payment frauds |
| Whole country | 4,195 | 606 | 122 | 30 | 641 | 53 | 732 |
| Uusimaa | 5,593 | 801 | 157 | 46 | 875 | 69 | 700 |
| Varsinais-Suomi | 3,780 | 635 | 114 | 32 | 516 | 66 | 557 |
| Satakunta | 3,139 | 614 | 85 | 25 | 569 | 42 | 462 |
| Kanta-H�me | 3,528 | 543 | 112 | 14 | 667 | 22 | 603 |
| Pirkanmaa | 4,230 | 647 | 138 | 40 | 656 | 47 | 650 |
| P�ij�t-H�me | 4,201 | 718 | 136 | 26 | 570 | 46 | 893 |
| Kymenlaakso | 3,948 | 550 | 178 | 22 | 609 | 53 | 559 |
| South Karelia | 3,253 | 483 | 138 | 18 | 495 | 48 | 494 |
| Etel�-Savo | 2,711 | 514 | 82 | 11 | 508 | 31 | 482 |
| Pohjois-Savo | 2,771 | 314 | 55 | 19 | 523 | 60 | 456 |
| North Karelia | 2,515 | 269 | 66 | 14 | 503 | 39 | 393 |
| Central Finland | 3,416 | 491 | 80 | 23 | 521 | 55 | 627 |
| South Ostrobothnia | 1,816 | 279 | 50 | 10 | 324 | 34 | 292 |
| Ostrobothnia | 2,957 | 460 | 101 | 15 | 510 | 24 | 293 |
| Central Ostrobothnia | 1,957 | 309 | 59 | 6 | 417 | 32 | 255 |
| North Ostrobothnia | 3,435 | 548 | 140 | 28 | 503 | 41 | 559 |
| Kainuu | 2,815 | 335 | 64 | 15 | 528 | 39 | 511 |
| Lapland | 3,473 | 480 | 109 | 12 | 570 | 48 | 581 |
| �land | 3,050 | 635 | 86 | 28 | 725 | 59 | 238 |
1.3. Offences against the person
In 2016, a total of 33,800 assault offences (assault, petty assault, aggravated assault) were recorded, which was 100 cases (0.3 per cent) fewer than in 2015. Aggravated assaults increased by 1.9 per cent compared to the previous year. The number recorded was 1,590. Over the past ten years (2007 to 2016), 35,000 assaults, on average, have been reported yearly. The legislative amendment, which entered into force at the beginning of 2011, considerably increased the number of assault offences recorded in 2011. After the legislative amendment, petty assaults on minors or close relatives became officially prosecutable. In 2011, 40,200 assault offences were recorded.
The recorded number of offences against life was 78. This was 18 cases fewer than in 2015. The number of offences against life in 2015 included 12 murders made with terrorist intent abroad, which the Finnish police were investigating. Of the offences against life recorded in 2016, two were murders made with terrorist intent. The annual average for the past ten years is 106. The corresponding figure was 130 between 1997 and 2006. Altogether 311 attempted manslaughters, murders or killings were recorded, which was 12 more than in 2015. When recording an offence, the line between attempted manslaughter and aggravated assault is open to interpretation, which may have an effect on the level changes visible in the statistics.
A total of 1,160 rapes (rape, aggravated rape, Paragraph 3) were recorded, which is 10.3 per cent more than in 2015. From 2007 to 2016, an average of 938 rapes were reported per year. The recorded number of sexual exploitations of a child was 1,240, which is one per cent more than in the year before. The number of sexual harassment cases recorded was 535, which was 252 cases (89 per cent) more than in 2015. Sexual harassment was added to the Penal Code on 1 September 2014. The recorded numbers of rapes and sexual exploitations of a child can vary much yearly. Individual reports may include a series of incidents comprising several criminal acts.
In 2016, 58 per cent of offences against the person and 38 per cent of assault offences were committed in private dwellings. In all, 15.1 per cent of rape offences were committed in public places. The corresponding share was 18.7 per cent in 2015 and 23.5 per cent of rape offences were committed in public places in 2009. More than one-half of sexual harassment cases occurred in a public place or in a public event.
Table 2. Selected violent offences by region per 100,000 population in 2016
| Region | Manslaughter, murder, killing and their attempts | Assault | Aggravated assault | Petty assault | Rape offences |
| Whole country | 7 | 415 | 29 | 170 | 21 |
| Uusimaa | 7 | 511 | 25 | 180 | 24 |
| Varsinais-Suomi | 5 | 348 | 23 | 212 | 16 |
| Satakunta | 7 | 364 | 39 | 169 | 14 |
| Kanta-H�me | 4 | 321 | 42 | 202 | 14 |
| Pirkanmaa | 5 | 387 | 28 | 170 | 18 |
| P�ij�t-H�me | 7 | 359 | 34 | 113 | 19 |
| Kymenlaakso | 7 | 331 | 28 | 151 | 17 |
| South Karelia | 4 | 318 | 25 | 202 | 19 |
| Etel�-Savo | 6 | 352 | 24 | 198 | 16 |
| Pohjois-Savo | 8 | 331 | 32 | 228 | 24 |
| North Karelia | 5 | 279 | 26 | 219 | 13 |
| Central Finland | 10 | 518 | 34 | 158 | 25 |
| South Ostrobothnia | 7 | 343 | 30 | 105 | 7 |
| Ostrobothnia | 4 | 351 | 22 | 93 | 19 |
| Central Ostrobothnia | 1 | 420 | 30 | 114 | 18 |
| North Ostrobothnia | 6 | 388 | 29 | 110 | 16 |
| Kainuu | 6 | 452 | 33 | 215 | 11 |
| Lapland | 14 | 440 | 39 | 168 | 43 |
| �land | 3 | 434 | 38 | 134 | 31 |
1.4. Offences involving intoxicating substances
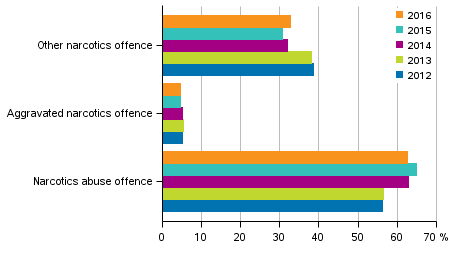
In all, 25,100 narcotics offences were recorded in 2016, which was 1,700 cases (7.2 per cent) more than in 2015. The number of aggravated narcotics offences went up by 10.2 per cent from the previous year. A total of 1,179 of them were recorded. Good 60 per cent of narcotics offences are use offences. In all, 15,700 cases were recorded, which was 550 cases (3.6 per cent) more than in 2015.
From 2009, the figures include the offences recorded by the customs and border guard, which increases the number of narcotics offences by about one-tenth compared with narcotics offences known to the police.
Figure 4. Narcotics offences in 2012–2016
The recorded number of alcohol offences and minor alcohol offences was 2,900, which was 320 cases, or 10.0 per cent lower than in 2015.
When compiling statistics on offences involving intoxicating substances, offences comprising several criminal acts are entered as one. Offences involving intoxicating substances are such that they are generally found out only as a result of the activity of the police or customs and border guard officials and the majority of the offences remain undisclosed.
1.5 Drunken driving and traffic offences
Aggravated drunken driving decreased by 6.8 per cent and other drunken driving increased by 2.0 per cent from 2015. In all, 17,300 drunken driving offences were recorded, which was 300 cases or 1.9 per cent lower than in the previous year. The number of drunken driving offences recorded has primarily been decreasing in the past ten years. They have fallen by over one-third from the record figures of 1990.
Figure 5. Drunken driving offences in 1980–2016
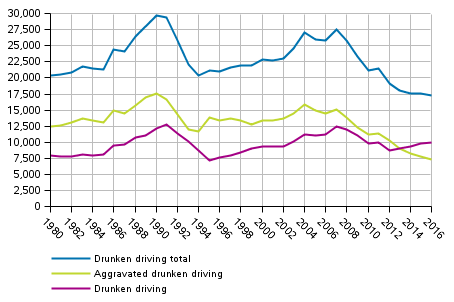
In 66.5 per cent of drunken driving cases the intoxicant was alcohol and in 29.0 per cent some other narcotic substance. The remaining 4.5 per cent had used both. Drunken driving caused by alcohol decreased by 5.5 per cent, that caused by narcotic substances increased by 6.2 per cent and the combined use of alcohol and narcotic substances grew by 7.1 per cent.
Figure 6. Drunken driving offences by region per 100,000 population in 2016
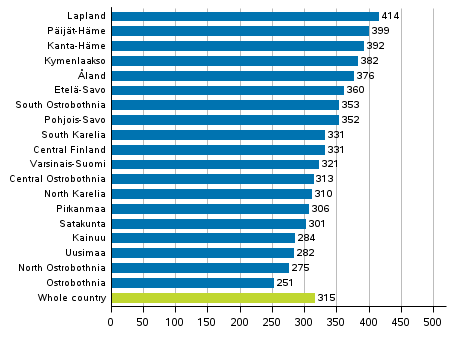
In 2016, a total of 411,700 cases of endangerment of traffic safety, traffic infractions, violations of social welfare legislation on road traffic and motor vehicle infractions were registered, which was 1.5 per cent more than in 2015. Most of them were offences found out in connection with police surveillance and guidance. The recorded number of aggravated endangerment of traffic safety was 3,900, which was 0.8 per cent down on 2015. The police recorded 299,300 cases of exceeding speed limits, which was 2.9 per cent higher than in the year before. Problems connected to the re-organisation of automatic traffic control brought about a substantial fall in the number of traffic offences recorded in the early part of 2014 compared with 2013. The figures for 2013 are not fully comparable with those for 2012, because exceeding speed limits detected by automatic traffic control towards the end of 2012 were recorded in the early part of 2013.
Source: Statistics on offences and coercive measures 2016, Offences reported. Statistics Finland
Inquiries: Kimmo Haapakangas 029 551 3252, rikos@stat.fi
Director in charge: Jari Tarkoma
Updated 23.3.2017
Official Statistics of Finland (OSF):
Statistics on offences and coercive measures [e-publication].
ISSN=2342-9178. Reported offences, 1st quarter 2016,
1. Review on offences recorded by the police, customs and border guard
. Helsinki: Statistics Finland [referred: 6.2.2026].
Access method: http://stat.fi/til/rpk/2016/13/rpk_2016_13_2017-03-23_kat_001_en.html

