1. Review on offences recorded by the police, customs and border guard
Property offences decreased, sexual and traffic offences increased in 2018
1.1. Summary
A total of 873,400 offences and infractions were recorded in 2018 by the police, customs and border guard, which was 1.3 per cent more than one year before. Of these offences and infractions, 443,500 were offences against the Criminal Code. Their number increased by 1.2 per cent from the previous year. Most offences outside the Criminal Code consists of traffic infractions, violations of social welfare legislation on road traffic and motor vehicle infractions. Altogether, 386,400 cases of exceeding speed limits were reported, which is three per cent more than in the year before. Exceeding of speed limits can be recorded either as endangerment of traffic safety or as traffic infractions, so their growth also explains the growth in offences against the Criminal Code.
Figure 1 Offences against the Criminal Code 1980 to 2018
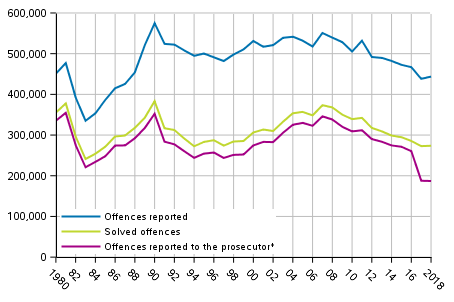
*After 2016 not all of the Traffic offences are reported to prosecutor
Most of the offences and infractions are recorded by the police. The police recorded 858,600 offences and infractions in 2018, which was 1.4 per cent more than one year before. Offences against the Criminal Code increased by 1.2 per cent. A total of 433,900 of them were recorded.
Customs recorded 8,900 offences and infractions of which 7,400 were offences against the Criminal Code. The border guard recorded 5,900 offences and infractions of which 2,300 were offences against the Criminal Code. Offences and infractions recorded by customs decreased by 4.3 per cent and those recorded by the border guard increased by 3.4 per cent.
During 2018, the police, customs and border guard solved a total of 694,700 of offences and infractions, which is 7.8 per cent more than in 2017. The clearance rate of all offences and infractions rose by nearly five percentage points, but the clearance rate of offences against the Criminal Code decreased slightly.
1.2 Offences against property
Recorded number of offences against property decreasing
A total of 207,000 offences against property were recorded in 2018, which is 1.8 per cent lower than in 2017.
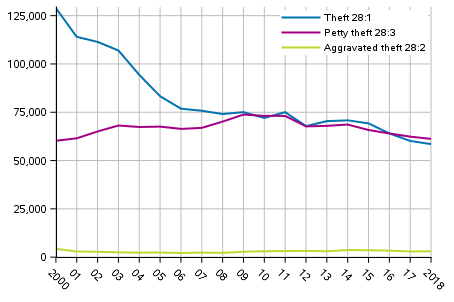
The recorded number of theft offences (Criminal Code, Chapter 28, Sections 1-3) was 122,700, which was 2.1 per cent (2,700 cases) fewer than in 2017. The number of aggravated thefts (Criminal Code, Chapter 28, Section 2) was 3,050, which is 130 cases more than in 2017. The number of petty thefts (Criminal Code, Chapter 28, Section 3) fell by 1.9 per cent (1,200 cases) and theft offences (Criminal Code, Chapter 28, Section 1) decreased by 2.8 per cent (1,700 cases) compared with the previous year. In all, 61,200 petty thefts and 58,500 thefts were reported. Compared to the beginning of the twenty-first century, theft offences have reduced by close on 40 per cent.
Altogether, 45,600 thefts and petty thefts from shops were recorded, which is 1.6 per cent more than in the year before.
Figure 2. Thefts 2000 to 2018
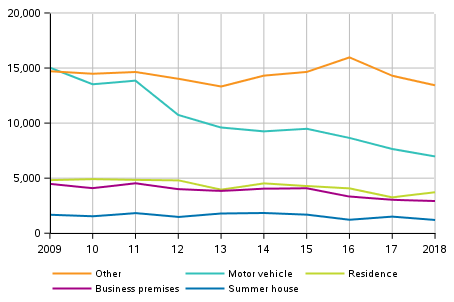
The number of reported burglaries (thefts, aggravated thefts or petty thefts through unlawful breaking in) was 28,300, which was 1,500 cases (5 per cent) fewer than in 2017. The number of burglary offences has been falling throughout the 2010s apart for a couple of exceptional years. Break-ins into cars have decreased especially much as their number has almost halved. In 2018, the number of break-ins into cars was 7,000.
The recorded number of break-ins into houses was 3,700 and break-ins into free-time residences 1,200. Break-ins into houses increased by 14.2 per cent and decreased by 20.6 per cent into free-time residences. The numbers of these offences vary much yearly but the general trend in the 2010s has been decreasing.
Figure 3. Burglaries 2009 to 2018
In total, 5,800 cases of stealing of a motor vehicle for temporary use (Criminal Code, Chapter 28, Section), aggravated stealing of a motor vehicle for temporary use and petty stealing of a motor vehicle for temporary use were recorded, which is five per cent less than in the year before.
Table 1. Thefts of use of a motor vehicle 2010-2018
| 2010 | 2011 | 2012 | 2013 | 2014 | 2015 | 2016 | 2017 | 2018 | |
| Total | 8,786 | 9,464 | 6,821 | 6,126 | 5,953 | 5,878 | 5,253 | 4,868 | 4,540 |
| Car | 6,045 | 5,996 | 4,335 | 3,645 | 3,511 | 3,712 | 3,253 | 2,937 | 2,893 |
| Moped | 1,770 | 2,116 | 1,631 | 1,560 | 1,524 | 1,240 | 1,088 | 929 | 795 |
| Motorcycle | 654 | 1,021 | 629 | 656 | 681 | 722 | 694 | 770 | 623 |
| Boat/vessel | 39 | 32 | 31 | 34 | 19 | 19 | 21 | 34 | 22 |
| Other motor vehicle | 278 | 299 | 195 | 231 | 218 | 185 | 197 | 198 | 207 |
Altogether, 1,700 robberies (Criminal Code, Chapter 31 , Section 1-2, Paragraph 2a) were recorded, which is 3.7 per cent more than in the year before. Of the robberies, 303 were aggravated, which is 39 cases more than in 2017. Nearly two-thirds of robberies occurred in public places.
The recorded number of damages to property was 30,500, which is 3,000 cases (9 per cent) fewer than in 2017. Reports of damages to property in private places decreased most. They decreased by nearly 20 per cent (2,200 cases). Damages to property in public places also decreased by close on 1,000 cases.
The number of reported frauds (Criminal Code, Chapter 36 , Section 1-3) made an upturn after a few years of decline. The number of reported frauds was 24,500, which is 1,100 cases (4.7 per cent) more than in the previous year. In all, 6,100 means of payment offences (Criminal Code, Chapter 37, Section 8-11) were reported, which is nearly 600 cases (8.5 per cent) fewer than in the previous year.
Examined by region, most offences against property were reported in Uusimaa, both measured in number of cases and relative to the size of the population. The offences are recorded based on the municipality where the offence occurs not the municipality of residence, so offences committed by tourists and other visitors are visible in the figures for that region.
Table 2. Selected offences against property by region per 100,000 population in 2018
| Offences against property | Theft 28:1 | Aggravated theft 28:2 | Petty theft 28:3 | Breaking into a residence | Breaking into a summer residence | Robberies total | Damages to property total | |
| Whole country | 3,784 | 1,063 | 55 | 1,112 | 67 | 22 | 31 | 552 |
| Uusimaa | 4,835 | 1,474 | 83 | 1,480 | 84 | 9 | 49 | 654 |
| Varsinais-Suomi | 3,383 | 1,080 | 45 | 855 | 60 | 13 | 21 | 520 |
| Satakunta | 2,945 | 875 | 52 | 755 | 74 | 35 | 23 | 516 |
| Kanta-H�me | 3,322 | 980 | 59 | 979 | 67 | 29 | 32 | 539 |
| Pirkanmaa | 3,559 | 1,099 | 51 | 1,112 | 68 | 25 | 29 | 528 |
| P�ij�t-H�me | 3,937 | 1,206 | 52 | 864 | 63 | 34 | 19 | 605 |
| Kymenlaakso | 3,570 | 883 | 51 | 824 | 65 | 40 | 25 | 562 |
| South Karelia | 4,046 | 1,005 | 39 | 1,202 | 61 | 30 | 16 | 471 |
| Etel�-Savo | 2,663 | 729 | 26 | 754 | 57 | 57 | 12 | 436 |
| Pohjois-Savo | 3,227 | 864 | 32 | 958 | 53 | 27 | 21 | 568 |
| North Karelia | 2,911 | 751 | 21 | 878 | 41 | 39 | 14 | 495 |
| Central Finland | 3,281 | 997 | 50 | 951 | 74 | 36 | 28 | 474 |
| South Ostrobothnia | 1,941 | 333 | 36 | 676 | 47 | 13 | 8 | 380 |
| Ostrobothnia | 2,606 | 669 | 37 | 828 | 45 | 17 | 13 | 451 |
| Central Ostrobothnia | 2,116 | 330 | 29 | 881 | 66 | 4 | 13 | 400 |
| North Ostrobothnia | 3,193 | 785 | 39 | 1,196 | 55 | 31 | 36 | 473 |
| Kainuu | 2,688 | 359 | 22 | 1,133 | 47 | 22 | 12 | 517 |
| Lapland | 3,028 | 621 | 49 | 866 | 61 | 23 | 18 | 560 |
| �land | 2,165 | 450 | 40 | 739 | 47 | 20 | 17 | 520 |
1.3 Violence and sexual offences
Number of reported sexual offences on the rise
In all, 85 suspected offences against life were reported. This is 12 cases more than in 2017. The number of offences against life have primarily been on the decline. Between 2010 to 2018, on average 94 cases per year have been recorded while between 2000 and 2009 the average was 128. Of all offences against life, 75 per cent committed in private dwellings or some other private location. The number of offences against life in 2015 included 12 murders made with terrorist intent abroad, which the Finnish police were investigating. Of the offences against life recorded in 2017, two were murders made with terrorist intent. Altogether, 355 attempted homicides were recorded, which is seven cases more than in the year before.
In 2018, a total of 33,600 assaults were reported which is 100 cases more than in 2017. In the 2010s and average of 35,000 assaults have been recorded per year. The number of basic assaults increased by 1.3 per cent. In all, 23,100 such assaults were reported. The number of aggravated assaults went up by 1.8 per cent. A total of 1,600 of them were recorded. The number of petty assaults recorded was 8,900, which is 2.4 per cent fewer than last year. The legislative amendment, which entered into force at the beginning of 2011, considerably increased the number of assault offences recorded in 2011. After the legislative amendment, petty assaults on minors or close relatives became officially prosecutable. In 2011, the number of assault offences recorded was 40,200.
A total of 1,393 rapes (rape, aggravated rape, Paragraph 3) were recorded, which is 11.9 per cent more than in 2017. Of all rape offences, 85 per cent were committed in private dwellings or some other private location. The recorded number of sexual abuses of a child was 1,373, which is 17.6 per cent more than in 2017. This is, however, almost 20 per cent fewer than in 2011. In addition, 1,013 other sexual offences were reported. Of them, 512 were cases of sexual harassment, which is 98 cases (23.7 per cent) more than in 2017. Sexual harassment was added to the Criminal Code on 1 September 2014. The numbers of rapes and sexual abuses of a child vary much yearly. Individual reports may include a series of incidents comprising several criminal acts.
Table 3. Selected violent offences by region per 100,000 population in 2018
| Offences against life and health | Offences against life and attempted | Assault 21:5 | Aggravated assault 21:6 | Petty assault 21:7 | |
| Whole country | 656 | 8 | 421 | 29 | 161 |
| Uusimaa | 720 | 8 | 489 | 27 | 158 |
| Varsinais-Suomi | 578 | 5 | 344 | 23 | 171 |
| Satakunta | 603 | 9 | 368 | 29 | 150 |
| Kanta-H�me | 607 | 9 | 351 | 39 | 180 |
| Pirkanmaa | 622 | 5 | 386 | 29 | 168 |
| P�ij�t-H�me | 573 | 10 | 358 | 35 | 135 |
| Kymenlaakso | 648 | 14 | 407 | 31 | 153 |
| South Karelia | 520 | 6 | 276 | 26 | 179 |
| Etel�-Savo | 741 | 12 | 386 | 32 | 253 |
| Pohjois-Savo | 676 | 7 | 341 | 30 | 263 |
| North Karelia | 542 | 10 | 314 | 22 | 162 |
| Central Finland | 769 | 6 | 534 | 32 | 163 |
| South Ostrobothnia | 648 | 8 | 457 | 28 | 128 |
| Ostrobothnia | 551 | 4 | 360 | 22 | 134 |
| Central Ostrobothnia | 715 | 18 | 517 | 26 | 126 |
| North Ostrobothnia | 560 | 10 | 387 | 41 | 97 |
| Kainuu | 775 | 7 | 489 | 29 | 200 |
| Lapland | 650 | 12 | 415 | 30 | 157 |
| �land | 517 | 3 | 322 | 23 | 111 |
Relative to the population in the region, most sexual offences were reported in Central Finland, 85 cases per 100,000 inhabitants. Most cases of sexual abuse of a child relative to the population were reported in �land. There, 11 cases of sexual abuse of a child were reported. In Northern Ostrobothnia, 115 cases of sexual abuse of a child were reported. This means 28 cases per 100,000 inhabitants.
Table 4. Sexual offences by region per 100,000 population in 2018
| Sexual offences | Sexual abuse of a child | Rape | Other sexual offences | |
| Whole country | 69 | 25 | 26 | 18 |
| Uusimaa | 81 | 27 | 30 | 24 |
| Varsinais-Suomi | 58 | 18 | 24 | 15 |
| Satakunta | 64 | 24 | 27 | 13 |
| Kanta-H�me | 50 | 18 | 21 | 11 |
| Pirkanmaa | 59 | 21 | 21 | 17 |
| P�ij�t-H�me | 55 | 20 | 22 | 12 |
| Kymenlaakso | 56 | 25 | 13 | 18 |
| South Karelia | 56 | 30 | 13 | 13 |
| Etel�-Savo | 46 | 17 | 17 | 13 |
| Pohjois-Savo | 79 | 25 | 32 | 22 |
| North Karelia | 57 | 20 | 20 | 16 |
| Central Finland | 85 | 34 | 28 | 24 |
| South Ostrobothnia | 67 | 34 | 24 | 8 |
| Ostrobothnia | 73 | 27 | 34 | 13 |
| Central Ostrobothnia | 39 | 3 | 19 | 18 |
| North Ostrobothnia | 64 | 28 | 19 | 17 |
| Kainuu | 59 | 18 | 22 | 19 |
| Lapland | 52 | 25 | 17 | 10 |
| �land | 67 | 37 | 17 | 13 |
1.4 Traffic offences and infractions
In 2018, a total of 116,400 traffic offences were recorded, which is 5.5 per cent more than in the year before. In addition, 413 900 traffic infractions, violations of social welfare legislation on road traffic, and motor vehicle infractions were recorded. Of all traffic offences and infractions, 386,400 were cases of exceeding speed limits. Their number increased by three per cent from the previous year.
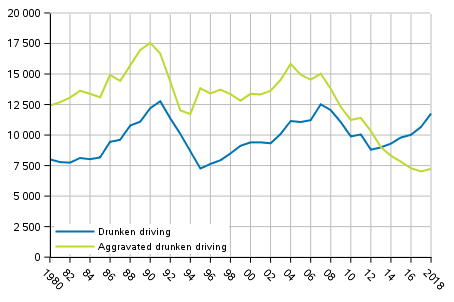
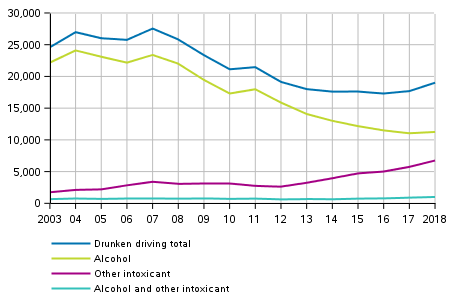
The number of drunken driving cases has made an upturn after several years of a declining trend. In 2018, a total of 19,000 cases of drunken driving were recorded, which is 1,300 cases (7.5 per cent) more than in the previous year. Cases of driving while intoxicated (Criminal Code, Chapter 23, Section 3) increased by 10.3 per cent from 2017. The number recorded was 11,800. Altogether, 7,200 cases of driving while seriously intoxicated (Criminal Code, Chapter 23 , Section 4) were recorded, which is 3.1 per cent more than in the year before.
Figure 4. Drunken driving offences in 1980–2018
In cases of driving while seriously intoxicated, alcohol is still the intoxicant in around 90 per cent of cases, but more than one-half of the cases of driving while intoxicated are caused by other narcotic substances.
Figure 5. Drunken driving offences after intoxicant in 2003–2018
Close on 300 waterway, air or rail traffic intoxication cases were recorded, which is approximately seven per cent more than in the year before. Fifty cases of non-motor powered traffic intoxication was recorded.
1.5 Narcotics and alcohol offences
Recorded narcotics offences still on the rise
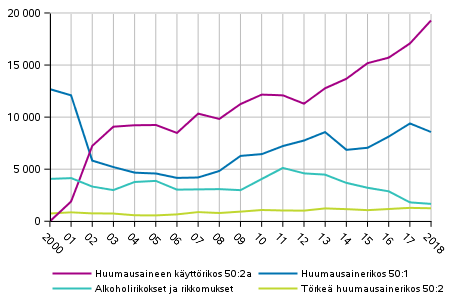
Altogether, 29,100 narcotics offences were recorded, which is 4.9 per cent more than in the year before. A total of 1,250 aggravated narcotics offences were recorded, which is 30 cases less than in 2017. Growth was strongest in unlawful use of narcotics. In total, 19,300 such cases were recorded, which is 2,200 cases (13 per cent) more than in the previous year.
Close on 1,700 alcohol offences (Criminal Code, Chapter 50a) and infractions were recorded . This is 7.8 per cent lower than in the year before.
Figure 6. Alcohol and narcotics offences in 2000 to 2018
When compiling statistics on offences involving intoxicating substances, offences comprising several criminal acts are entered as one. Offences involving intoxicating substances are such that they are generally found out only because of the activity of the police, customs or border guard officials and most of the offences remain undisclosed.
1.6 Other offences and infractions
Altogether 4,900 reports of invasion of domestic premises and harassing communications (Criminal Code, Chapter 24, Sections 1-2) were recorded, which is 300 fewer cases than one year earlier. In all, 65 cases of invasion or aggravated invasion of public premises (Criminal Code, Chapter 24, Sections 3-4) were recorded. Illicit observation was reported 250 times, which is 20 cases more than in 2017.
In all, 8,800 menaces, 4,400 aggravated defamations, and close on 700 stalking cases were recorded. In these offences, the numbers are at the previous year’s level.
In all, 3,800 identity thefts were recorded, which is 3.9 per cent fewer than last year.
Nearly 400 employment offences (Criminal Code, Chapter 47) were reported, which is nearly 100 cases more than in the year before. Good 500 environmental offences (Criminal Code, Chapter 48) were recorded, which is approximately 50 cases more than in 2017.
1.7 Solving of offences
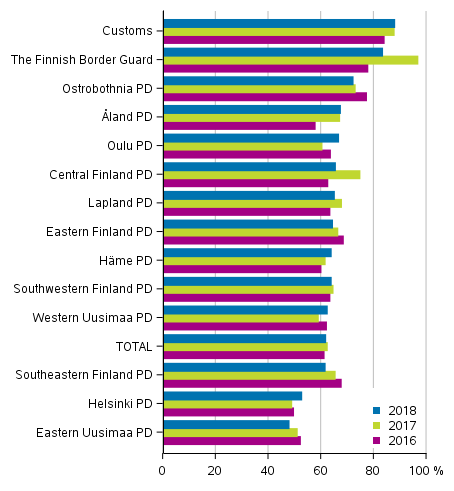
During 2018, the police, customs and border guard solved a total of 694,700 of offences and infractions, which is 7.8 per cent more than in 2017. The growth was mainly caused by an increase in the number of traffic offences and infractions. Altogether 273,600 offences against the Criminal Code were solved, which is good 700 cases more than in the previous year. The clearance rate of all offences and infractions was 79.5 per cent and the clearance rate of offences against the Criminal Code was 61.7 per cent. The corresponding rates were 74.8 and 62.3 per cent in 2017. The clearance rate is calculated as the share of solved offences in the statistical year compared to the number of reported offences in the statistical year. For this reason, the clearance rate may be over 100 per cent for some year.
The clearance rate varies by type of offence quite strongly. Only approximately 15 per cent of thefts (Criminal Code, Chapter 28, Section 1) are solved while one-half of petty theft (Criminal Code, Chapter 28, Section 3) cases are solved. The clearance rates of assault offences have decrease slightly in recent years. In 2018, the clearance rate of assault offences was 63 per cent having been 70 per cent in 2015. Due to the manner of disclosure, drunken driving and traffic offences, and offences involving intoxicating substances almost all become solved.
In 2018, a large number of sexual abuses of a child and rapes were recorded towards the end of the year, so they could not be cleared during that same year. This is visible in the drop of the clearance rate of such offences from the previous year.
Table 5. Clearance rate of certain types of offences in 1986-2018
| 1986 - 1990 | 1991 - 1995 | 1996 - 2000 | 2001 - 2005 | 2006 - 2010 | 2011 - 2015 | 2016 | 2017 | 2018 | |
| Offences against the Criminal Code | 69 | 58 | 57 | 63 | 67 | 63 | 61 | 62 | 62 |
| Theft 28:1 | 25 | 17 | 14 | 15 | 18 | 15 | 15 | 15 | 14 |
| Aggravated theft 28:2 | 39 | 29 | 40 | 41 | 38 | 34 | 32 | 37 | 31 |
| Petty theft 28:3 | 78 | 70 | 67 | 58 | 57 | 56 | 54 | 50 | 51 |
| Robberies total | 53 | 43 | 42 | 45 | 49 | 53 | 53 | 56 | 53 |
| Damages to property total | 29 | 27 | 27 | 26 | 25 | 22 | 22 | 22 | 24 |
| Attempted manslaughter, murder or killing | 95 | 91 | 92 | 94 | 97 | 92 | 88 | 100 | 84 |
| Assault 21:5 | 79 | 74 | 76 | 80 | 81 | 76 | 67 | 66 | 64 |
| Aggravated assault 21:6 | 85 | 84 | 83 | 87 | 88 | 84 | 81 | 80 | 77 |
| Petty assault 21:7 | 95 | 86 | 79 | 75 | 73 | 72 | 65 | 60 | 59 |
| Sexual abuse of a child | 91 | 84 | 88 | 82 | 86 | 75 | 69 | 63 | 52 |
| Rape | 63 | 56 | 57 | 63 | 66 | 70 | 67 | 71 | 55 |
The lowest clearance rates for offences against the Criminal Code were found in the It�-Uusimaa and Helsinki police departments. On the other hand, most offences were reported to the Helsinki police department, 72,700 cases. This is some 12,000 more than to the Sis�-Suomi police department, which recorded the second most offences.
Figure 7. Clearance rate of offences against the Criminal Code after authorities
Source: Statistics on offences and coercive measures 2018, Offences reported. Statistics Finland
Inquiries: Kimmo Haapakangas 029 551 3252, rikos@stat.fi
Director in charge: Jari Tarkoma
Updated 16.5.2019
Official Statistics of Finland (OSF):
Statistics on offences and coercive measures [e-publication].
ISSN=2342-9178. Reported offences, 1st quarter 2018,
1. Review on offences recorded by the police, customs and border guard
. Helsinki: Statistics Finland [referred: 16.2.2026].
Access method: http://stat.fi/til/rpk/2018/13/rpk_2018_13_2019-05-16_kat_001_en.html

